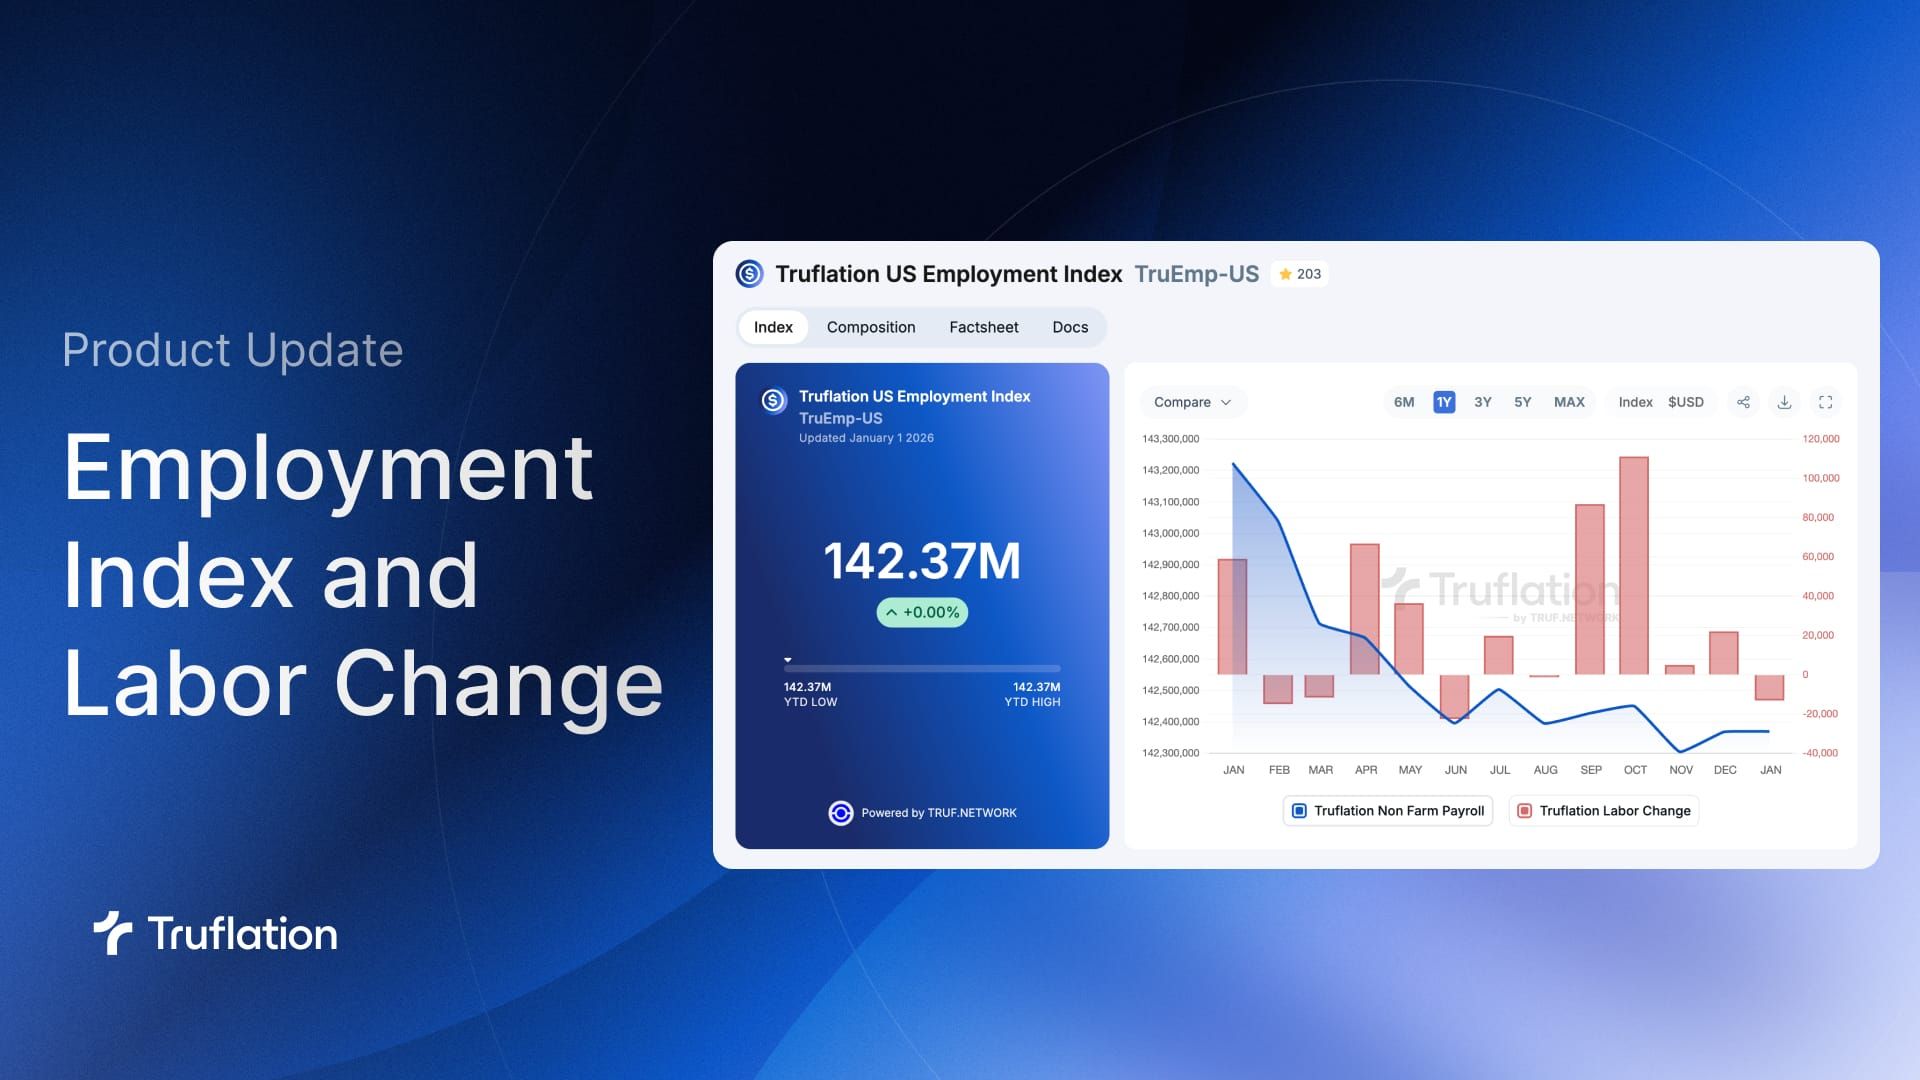
Product Update: Truflation Employment Index.
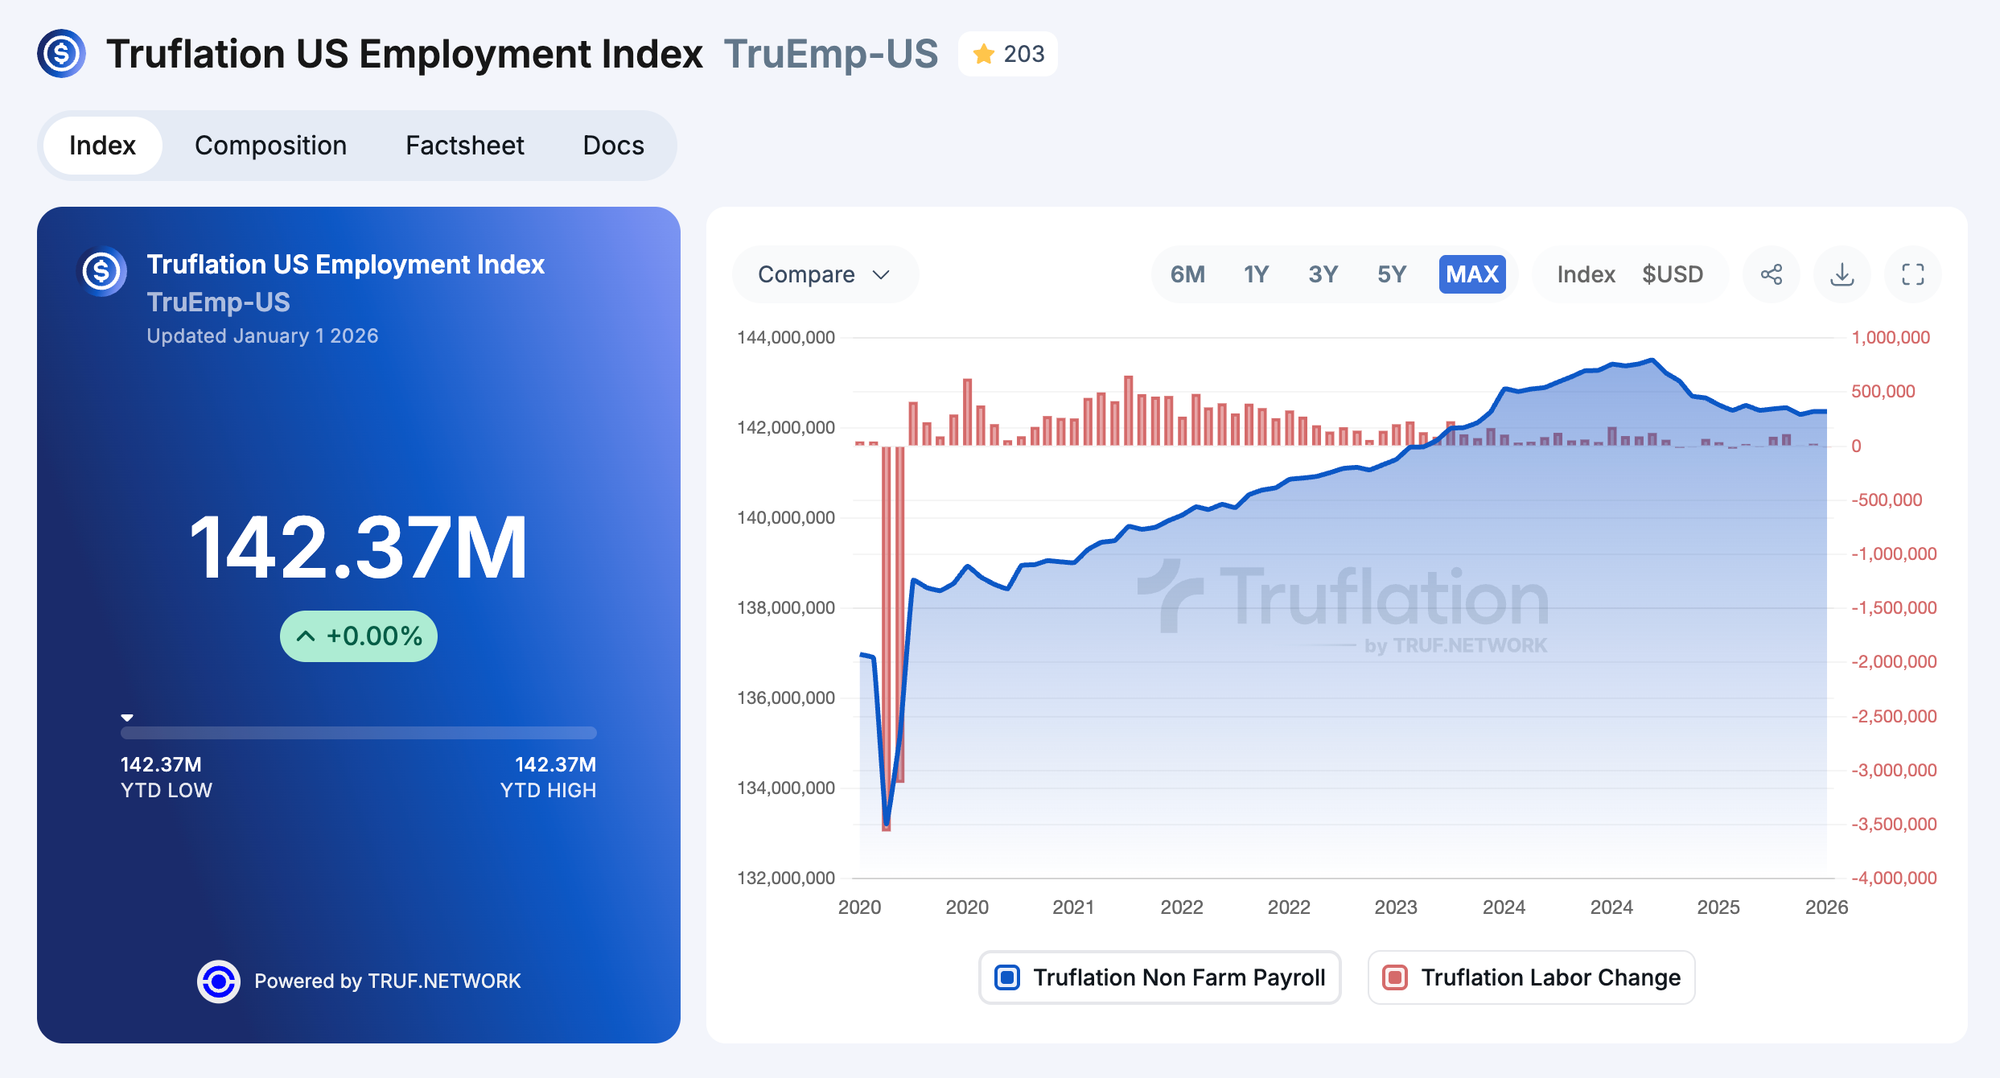
We're excited to add another data provider to our independent US Employment Index, which includes Total Non-Farm Payrolls and Non-Farm Labor Change and offers an alternative to BLS employment metrics.
This latest addition brings the total for our employment indexes up to 8 data sources, 5 of which are independent and 3 are government departments.
At Truflation, we strive to cover each data point with data from multiple providers to calculate a more accurate national average, reduce potential biases from any single dataset, and increase data redundancy useful in situations of data blackouts, such as during US government shutdowns.
This multi-source approach allows our Employment Index to better capture nuances in the labor market that a single indicator might miss, offering users a more balanced view of employment dynamics and a more unbiased and comprehensive view of the US economy.
Understanding the Labor Indexes
Nonfarm Payrolls and Total Nonfarm Employed Persons are two of the most widely referenced U.S. employment figures that come from the Bureau of Labor Statistics (BLS) Current Employment Statistics (CES) survey.
New Nonfarm Payrolls is the headline monthly jobs number released by the BLS on the first Friday of each month (covering the prior month's data). It measures the change in the number of paid employees on nonfarm payrolls—essentially, how many jobs were added or lost each month.
The index doesn't count the jobs listed below, making the index "non-farm:"
- Farm workers (agricultural employment is highly seasonal and volatile, so it's removed to focus on underlying trends)
- Private household employees (e.g., nannies, caregivers in homes)
- Unpaid volunteers
- Proprietors/unincorporated self-employed
- Active-duty military personnel
This index also counts jobs, not people, meaning someone with two jobs is counted twice. It covers roughly 80% of workers contributing to GDP.
This metric is the most market-moving employment indicator because it provides a direct read on business hiring activity and economic health.
Total Nonfarm Employed Persons is a total count of employees on nonfarm payrolls, not just the monthly change. It's the cumulative figure. It represents all the salaried employees in non-agricultural industries, again excluding the same groups as above.
In practice, "total nonfarm payroll employment" and "total nonfarm employed persons" (in the payroll context) are often used interchangeably in BLS reporting and discussions.
While the monthly change in nonfarm payrolls grabs headlines, the total level provides context on the overall size and recovery/growth trajectory of the job market.
Truflation created employment indexes that are directly comparable with the BLS indexes, but instead of single employment surveys, aggregate data from multiple sources.
Current Labor Trends
Our index shows the labor market cooling, with new non-farm payrolls coming in at the lowest levels in 3 years
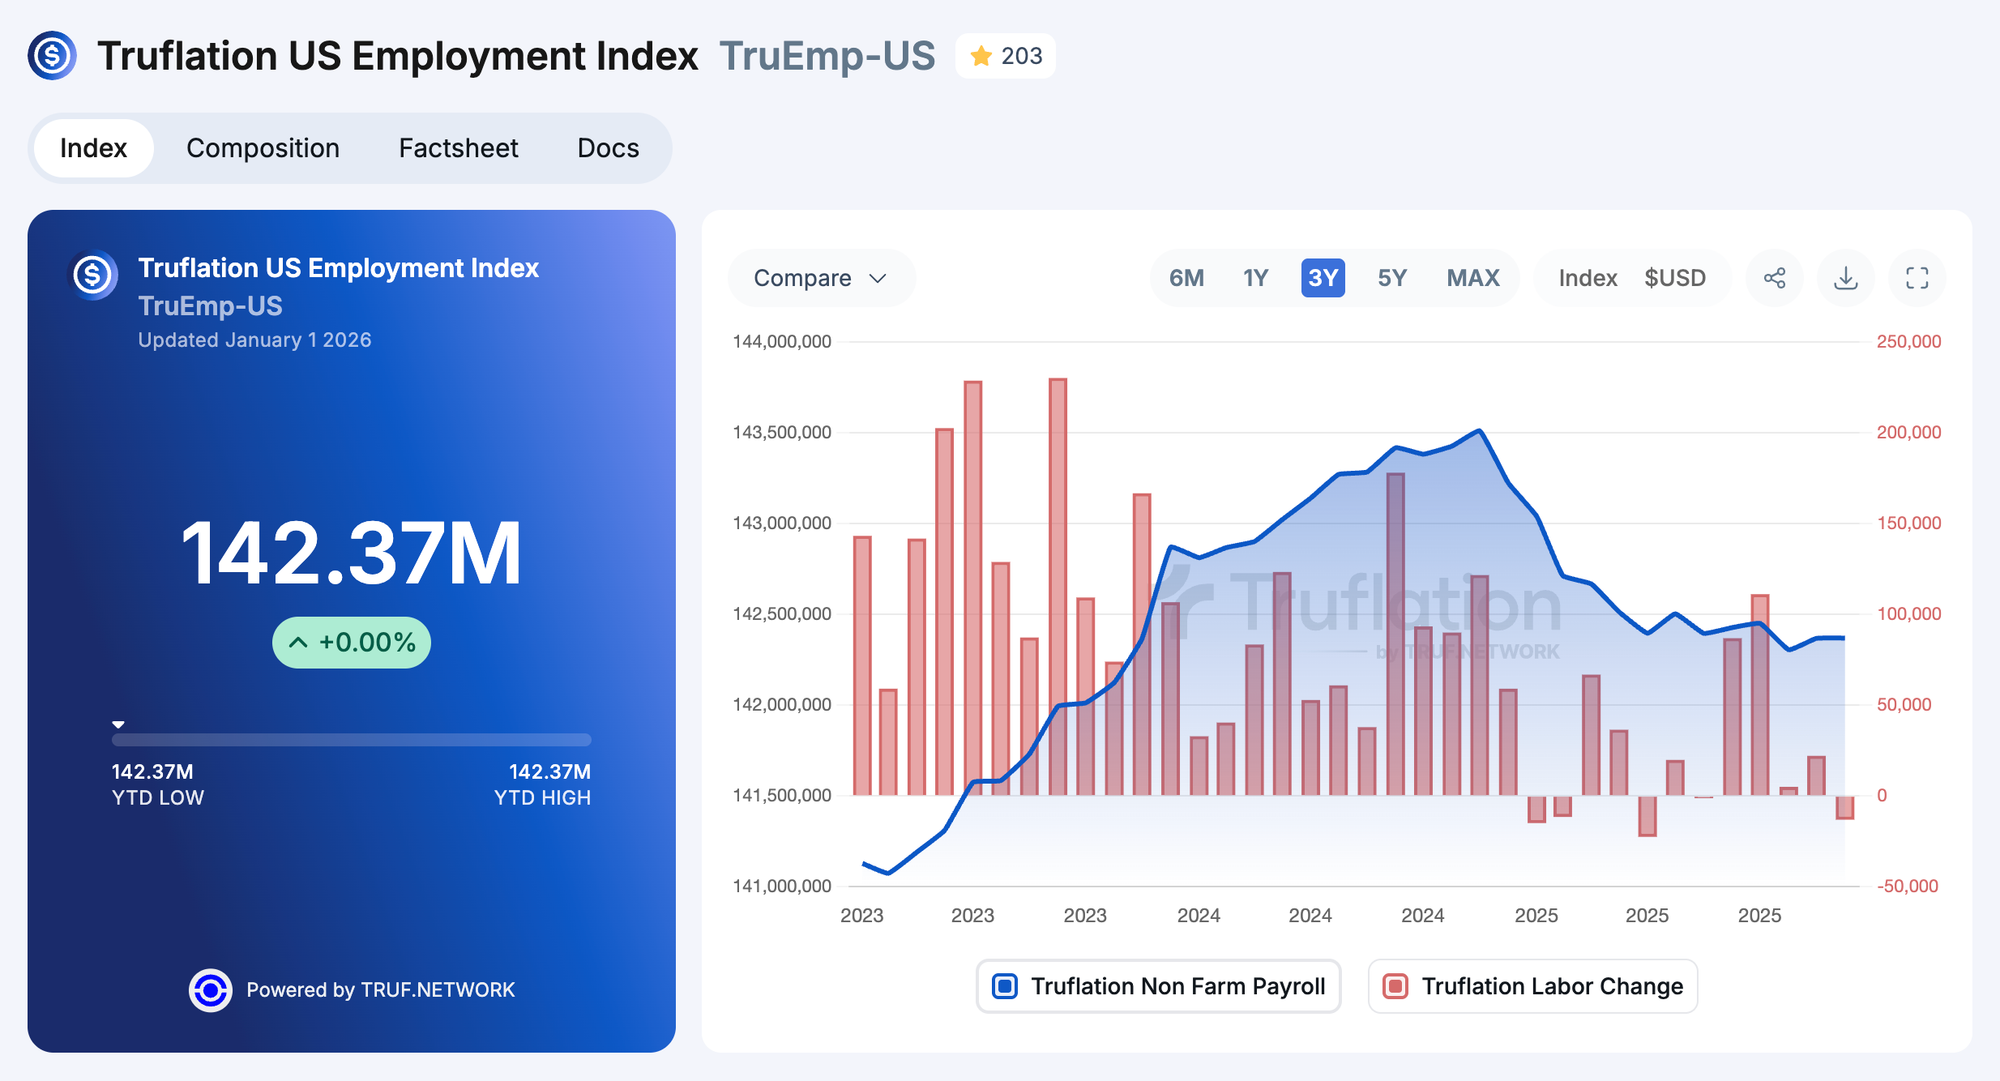
However, when zooming out, the total non-farm employment remains at stable, elevated levels, showing that the markets recovered from pandemic levels, reached a 5-year peak in 2024, and have cooled somewhat in 2025.