January PCE from BEA brings no surprises, unlike real-time PCE
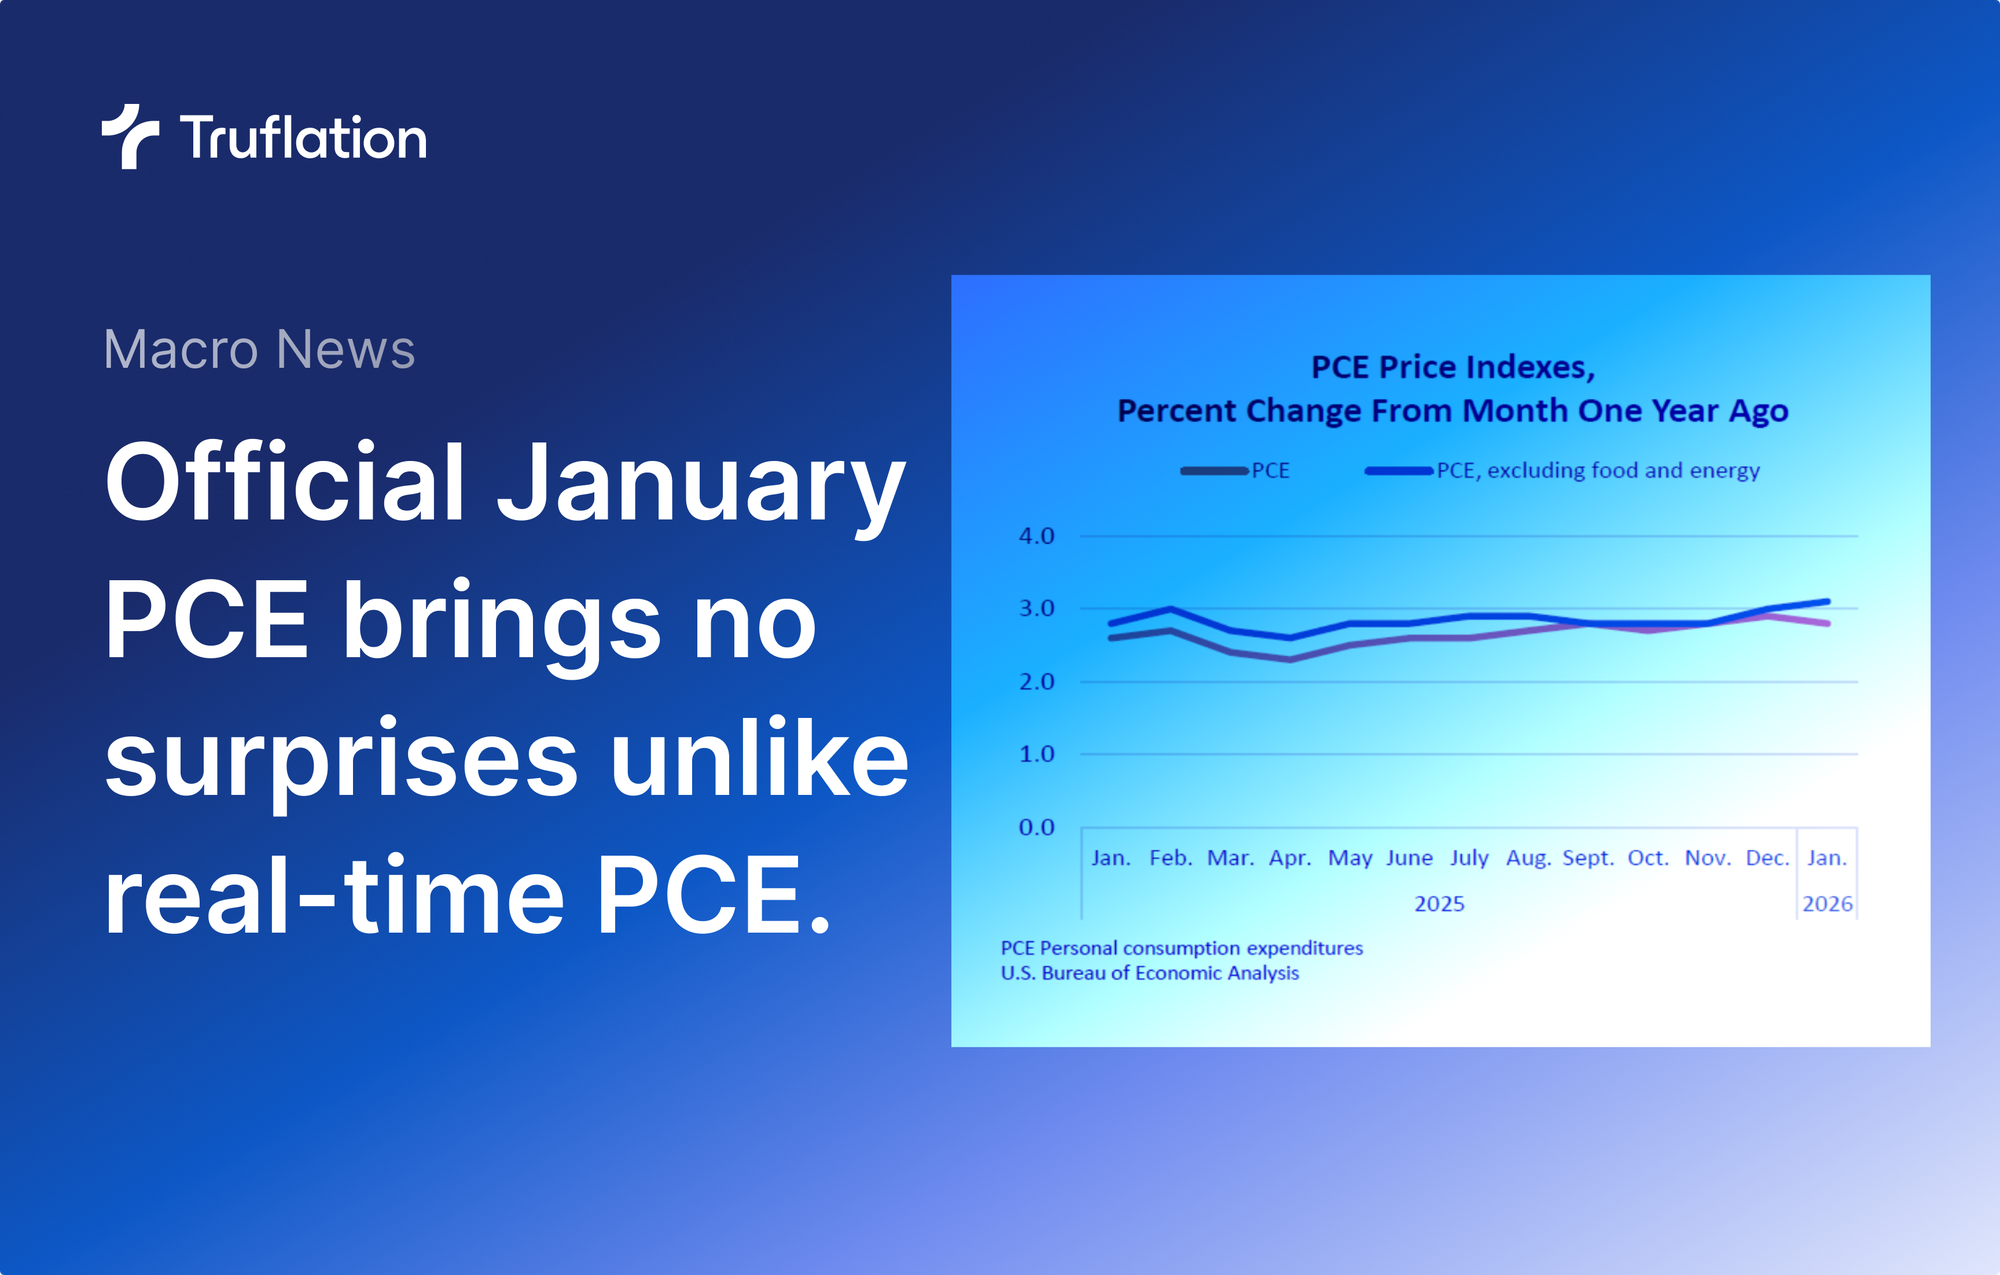
The PCE (Personal Consumption Expenditures) index came in cooler for January at 2.8% year-over-year, slightly below expectations, while core PCE inflation increased by 3.1% year-over-year, in line with market expectations.
- YoY US PCE: 2.8%, vs 2.9% previous and 2.9% expected
- YoY US Core PCE: 3.1%, vs 3% previous and 3.1% expected
- MoM PCE: 0.3%, vs 0.4% previous and 0.3% expected
- MoM Core PCE: 0.4%, vs 0.4% previous and 0.4% expected
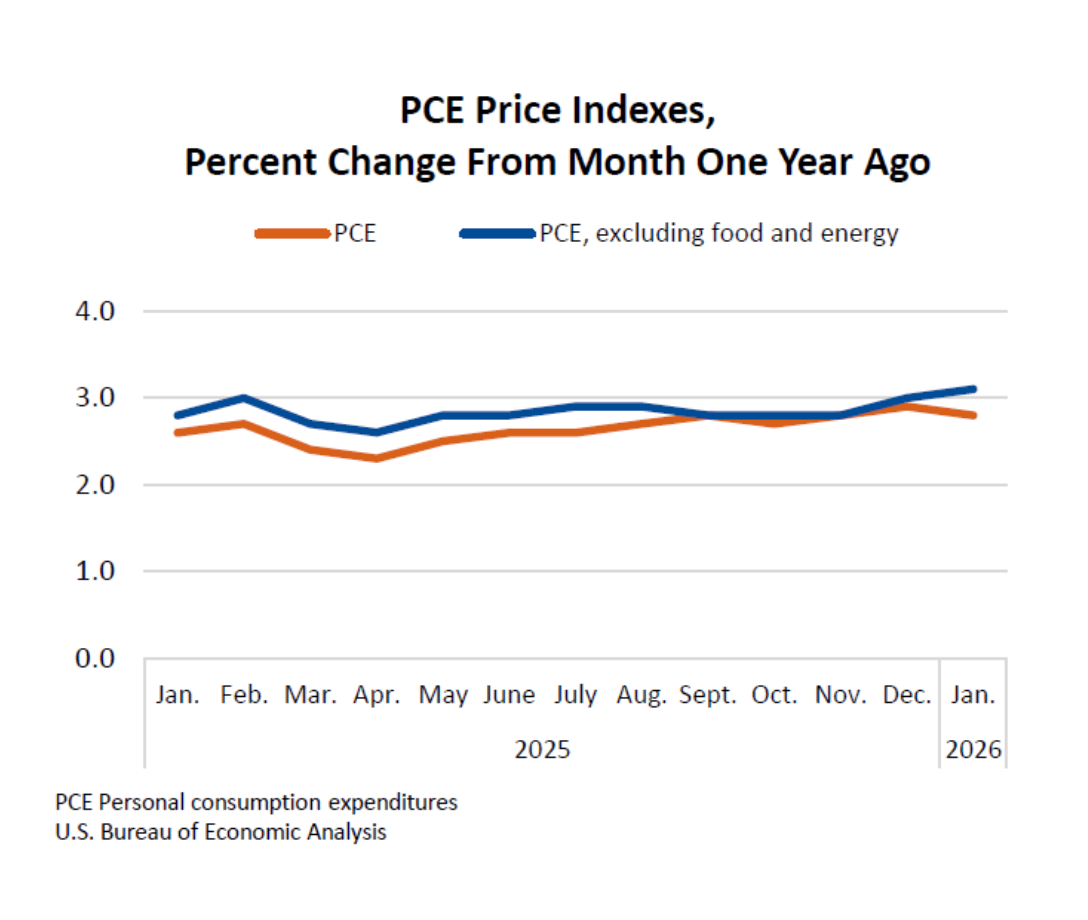
The slight YoY decrease comes after a near-2-year high of 2.9% in December, which surprised markets. It's also the 5th year since PCE has been above the 2% target.
Federal Reserve's Favorite Inflation Metric: Core PCE.
Core PCE (MoM, QoQ, and YoY) is the Federal Reserve's preferred gauge of inflation, which excludes volatile food and energy and captures longer-term consumer trends.
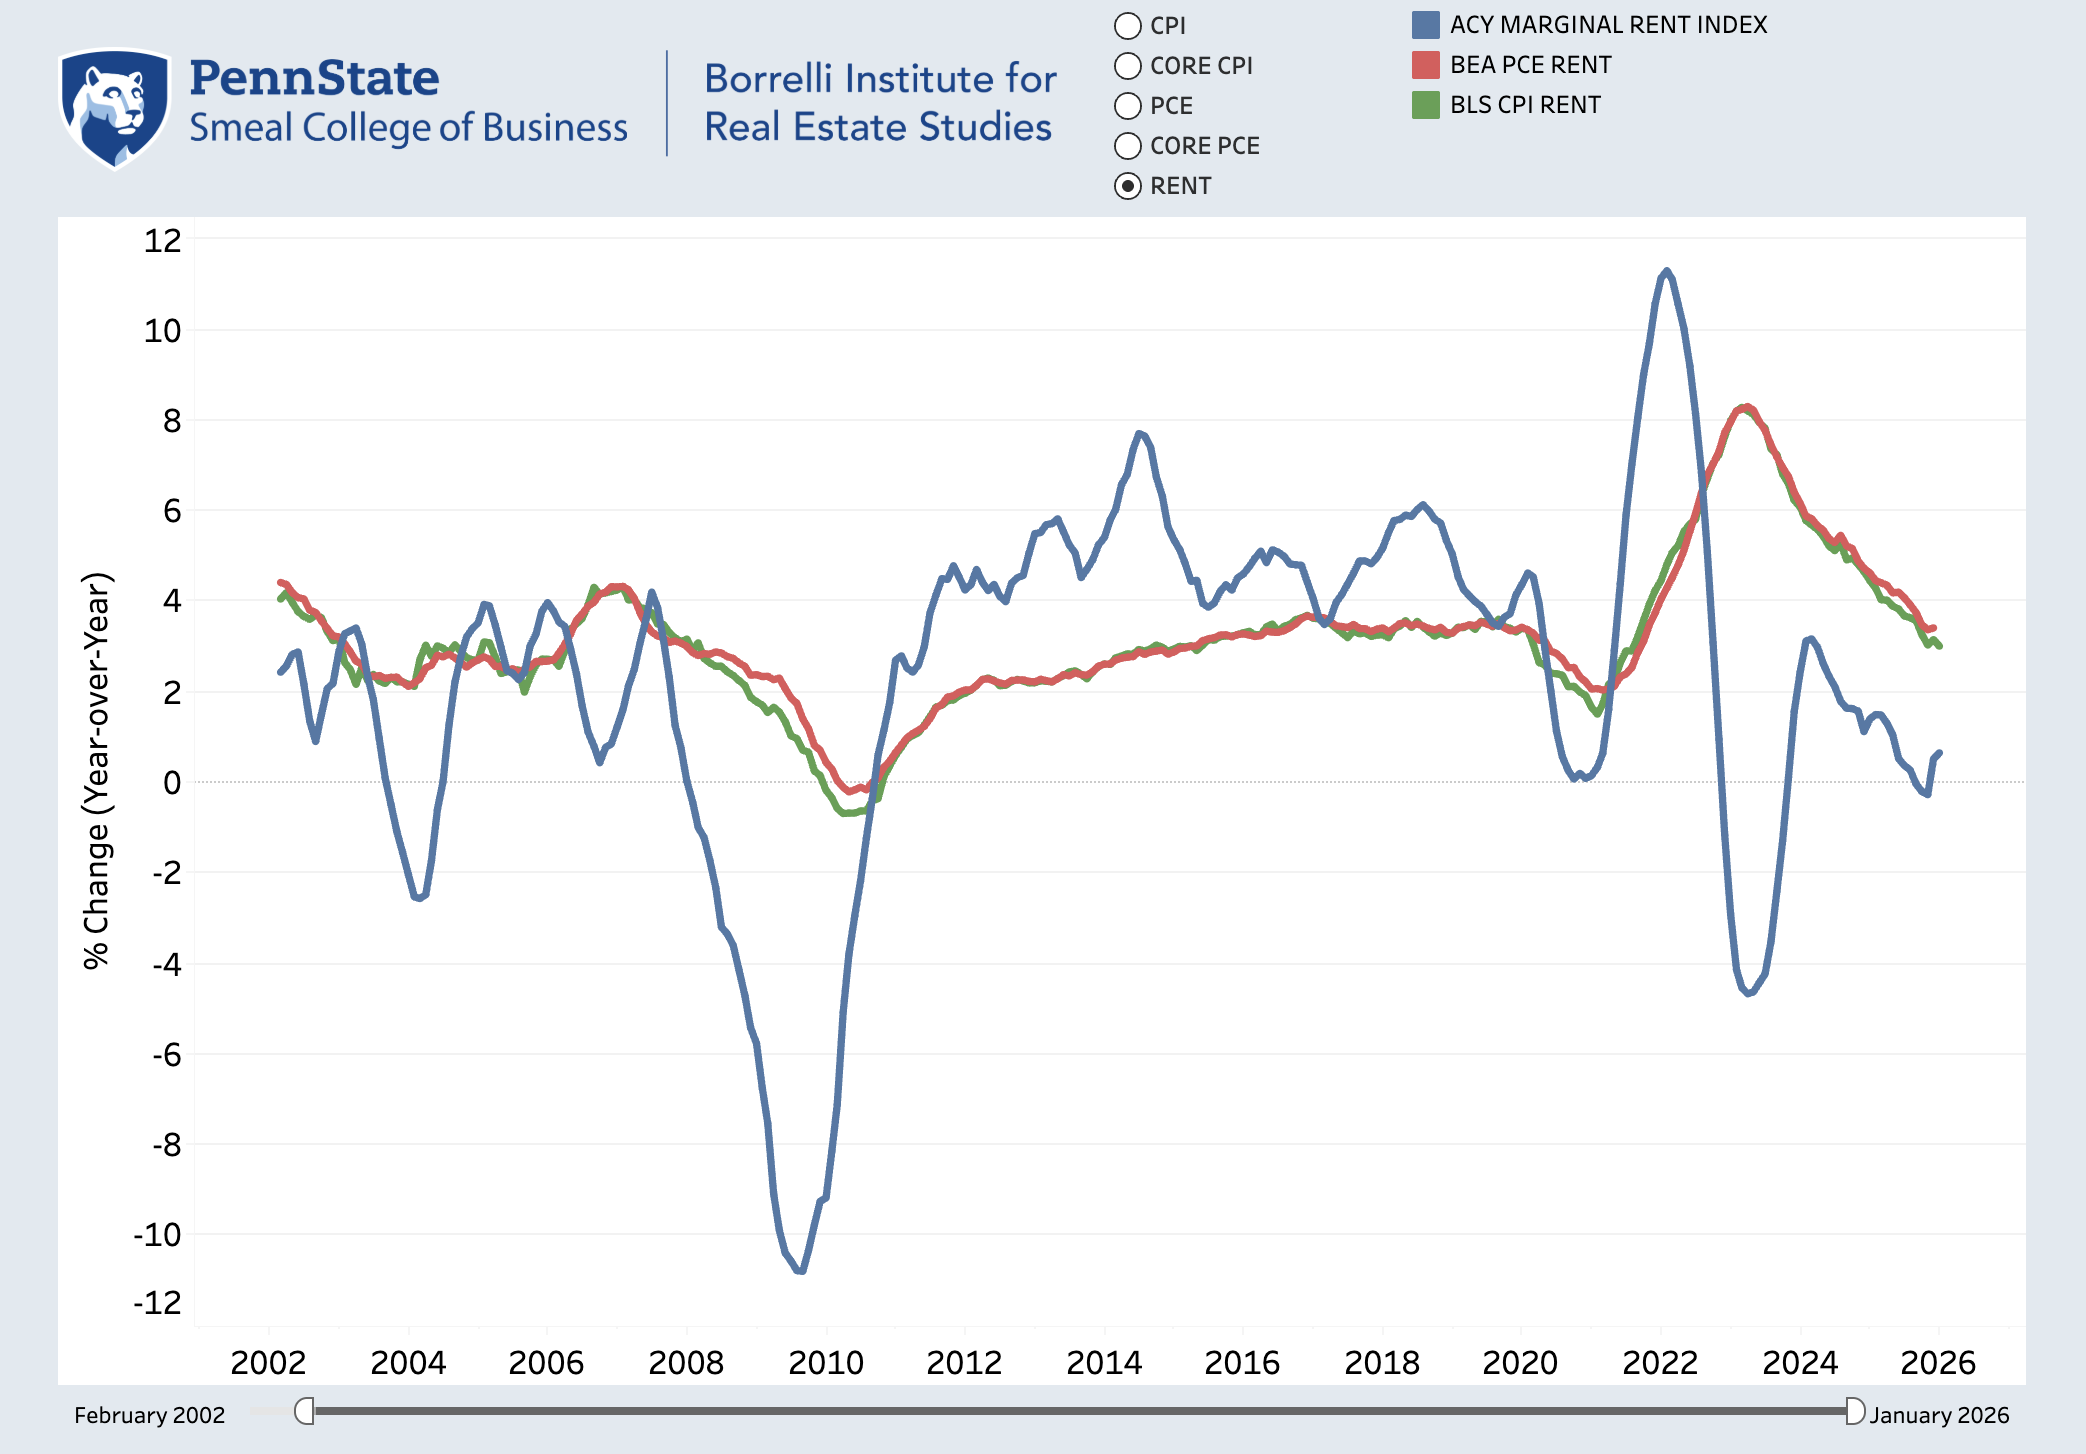
It's worth noting that the PCE data reflects the situation from months ago. Not only does it come a month later than the BLS CPI (January data released mid-March), but it also contains many inherent lags related to its survey-based character, especially within its rent index and category weightings.
Unlike real-world rent indexes, both the BEA and the BLS household-survey rent indexes do not capture larger price shifts or real-world conditions in the housing market, as shown in multiple research publications from Penn State University, with rent price fluctuations delayed by months and significantly flattened.
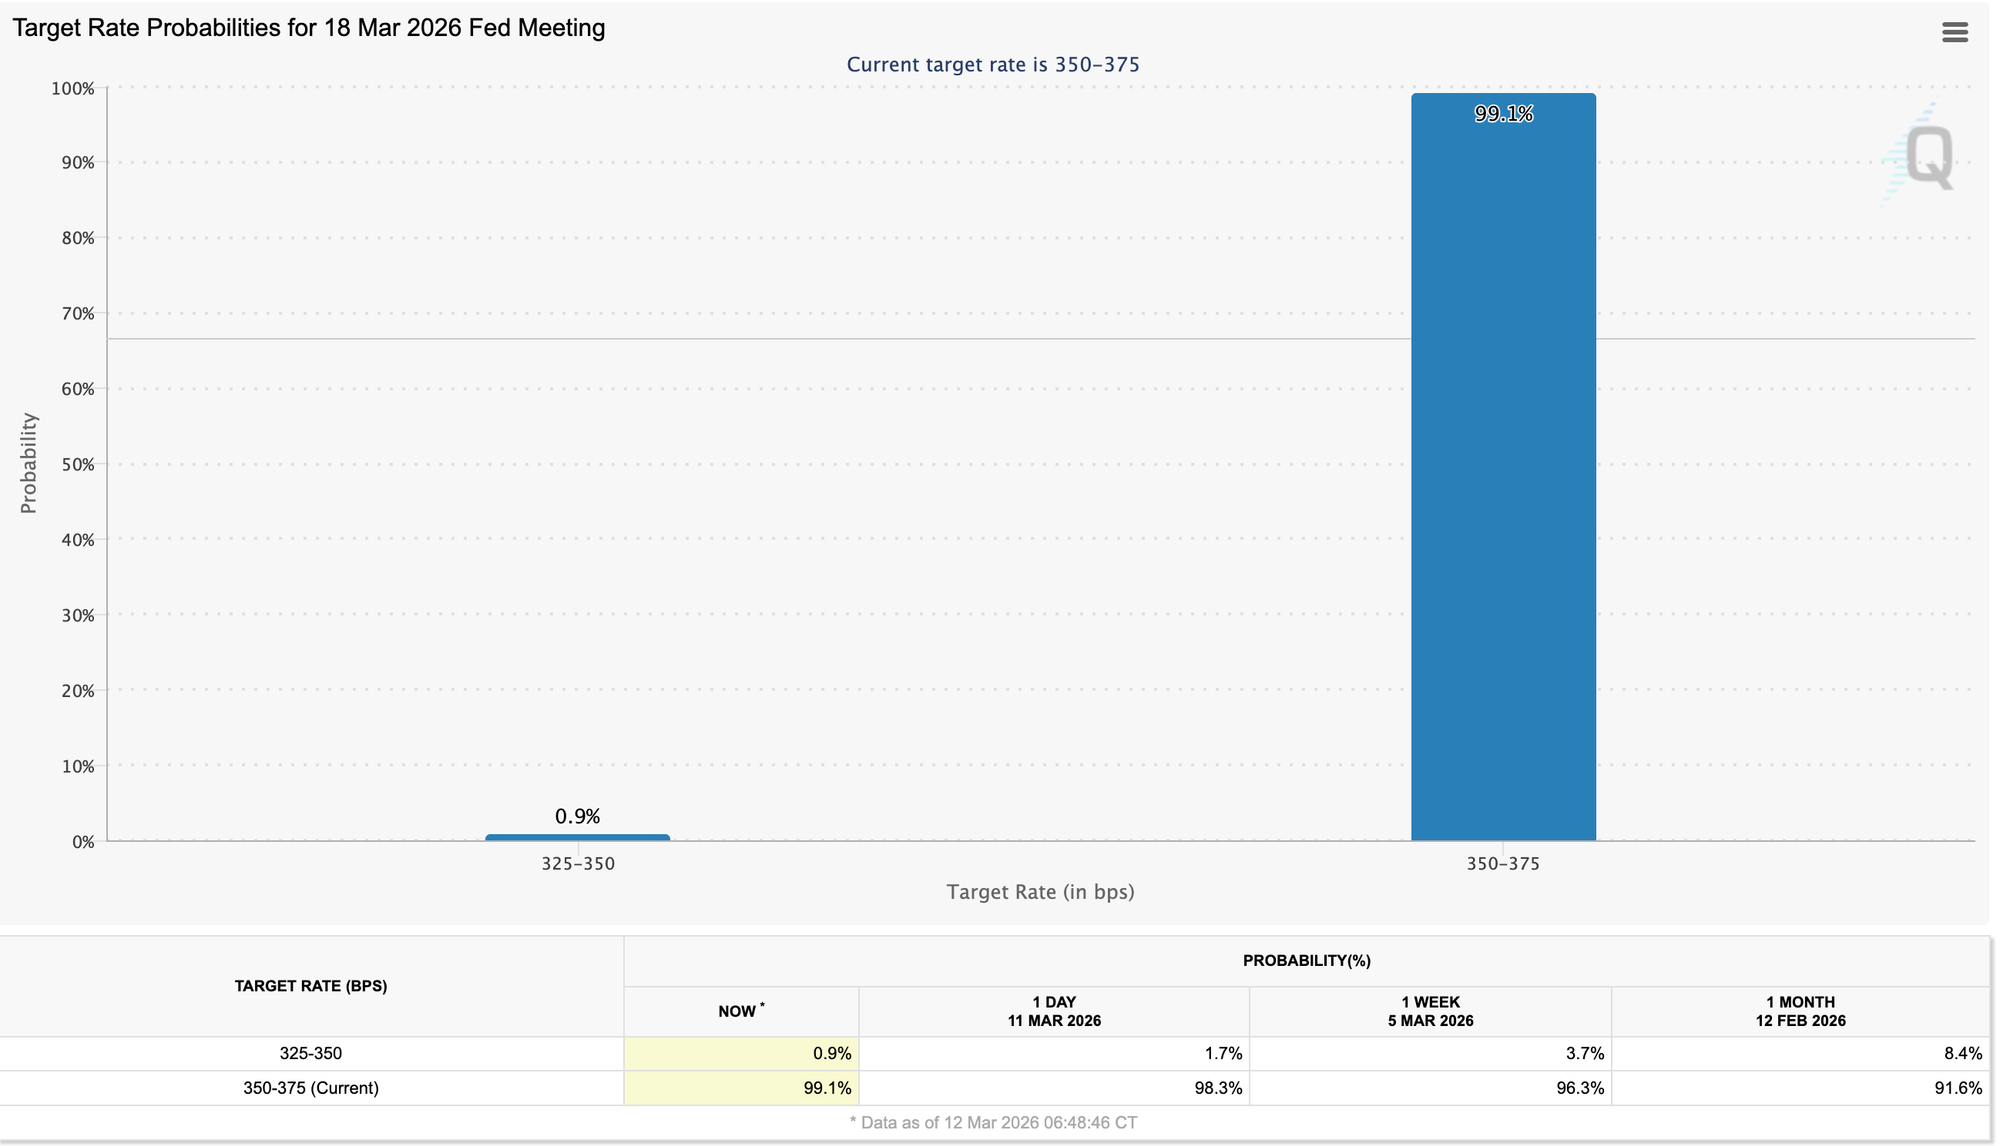
March FOMC Expectations
Regardless of the delays, this week's CPI for February and PCE for January will certainly be analyzed extensively at the upcoming FOMC meeting, the results of which we will learn on March 18, 2 PM EST.
The last CPI came in at 2.4%, still above the 2% target and in line with market expectations, reinforcing the pause-on-cuts narrative.
The markets are near-certain there won't be any interest rate cuts this month; however, the vote distribution and FOMC minutes will be analyzed for any signs of potential easing, not only through the interest rate cuts but also via potential Federal Reserve balance sheet expansion.
Real-Time PCE
While the official CPI and PCE remain flat, not responding to current global uncertainty around oil and shipping, Truflation's real-time data show that PCE dipped significantly in January and February from its 2025 highs, before rebouncing strongly 2.31% Y/Y and 2.4% for Core PCE today, amidst the Middle East crises and skyrocketing oil prices.
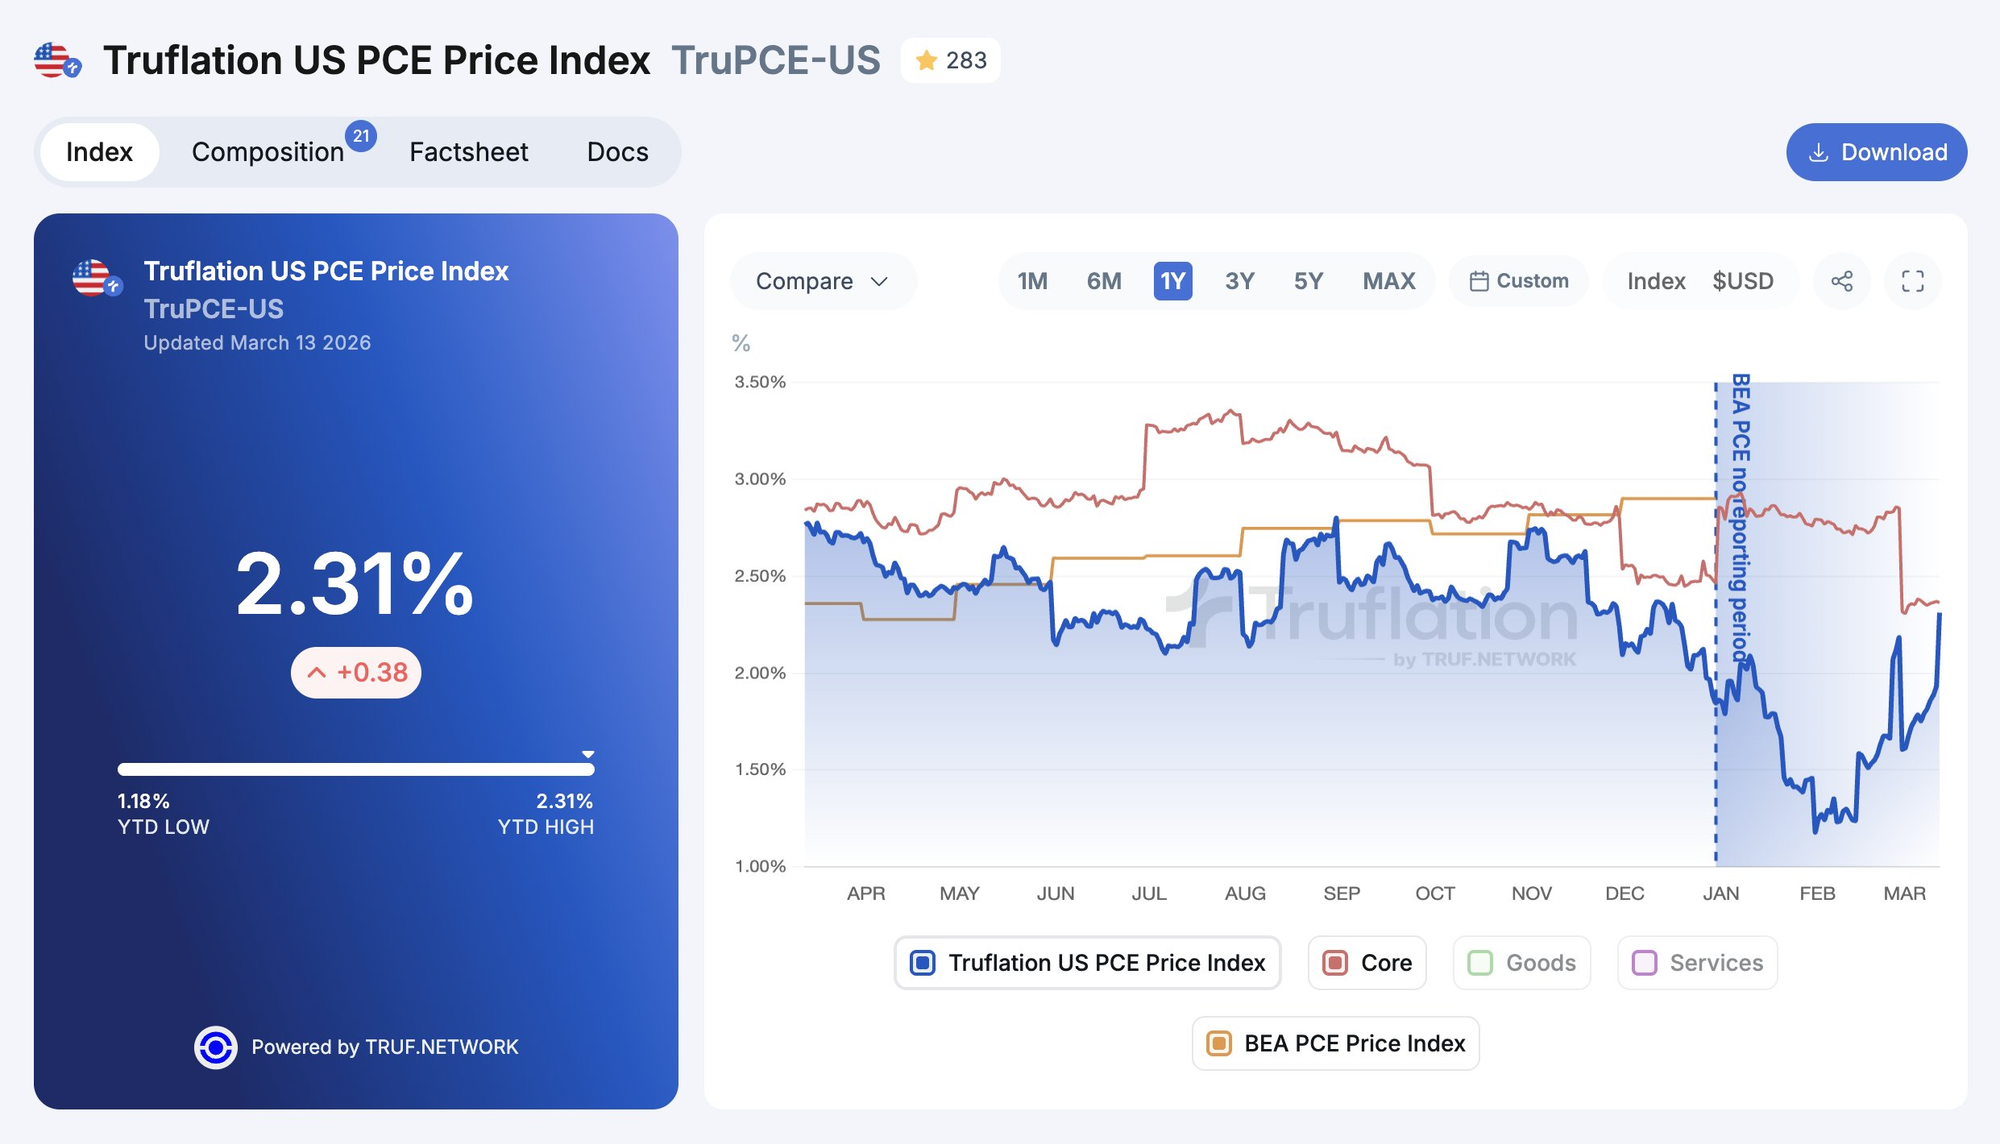
We obtain our PCE index by mapping millions of real transaction price data points onto the BEA PCE methodology, weightings, and categories distribution to capture real-time dynamics driving consumer prices and spending.
They Are Talking About Us
Truflation inflation indexes are preferred metrics for seasoned fund managers and economists worldwide. This week we were mentioned by:
- Danielle DiMartino Booth
Big pop in pump prices will drag on discretionary spending when wages succumbing to disinflation. And consider starting point of 0.7% GDP coming into 2026 (which today’s GDP revisions demonstrate were driven WAY MORE by fundamentals vs old narrative of “It was just the shutdown”) https://t.co/JYsTqK4yMb
— Danielle DiMartino Booth (@DiMartinoBooth) March 13, 2026
- Peter St Onge
Oil is bleeding into general inflation.
— Peter St Onge, Ph.D. (@profstonge) March 13, 2026
A month ago we were at 0.7% inflation.
Now that's 1.5% and rising fast. https://t.co/DXDJVrVZuf
- and Antony Pompliano
Truflation is showing inflation at 1.47% this morning.
— Anthony Pompliano 🌪 (@APompliano) March 13, 2026
The metric has been rapidly going higher since the Strait of Hormuz has been closed.
Another signal that Truflation is the most accurate inflation metric in the world. pic.twitter.com/AGvoR7ywAt
Who also suggested the Federal Reserve might have a political bias, not cutting interest rates based on the falling inflation data.