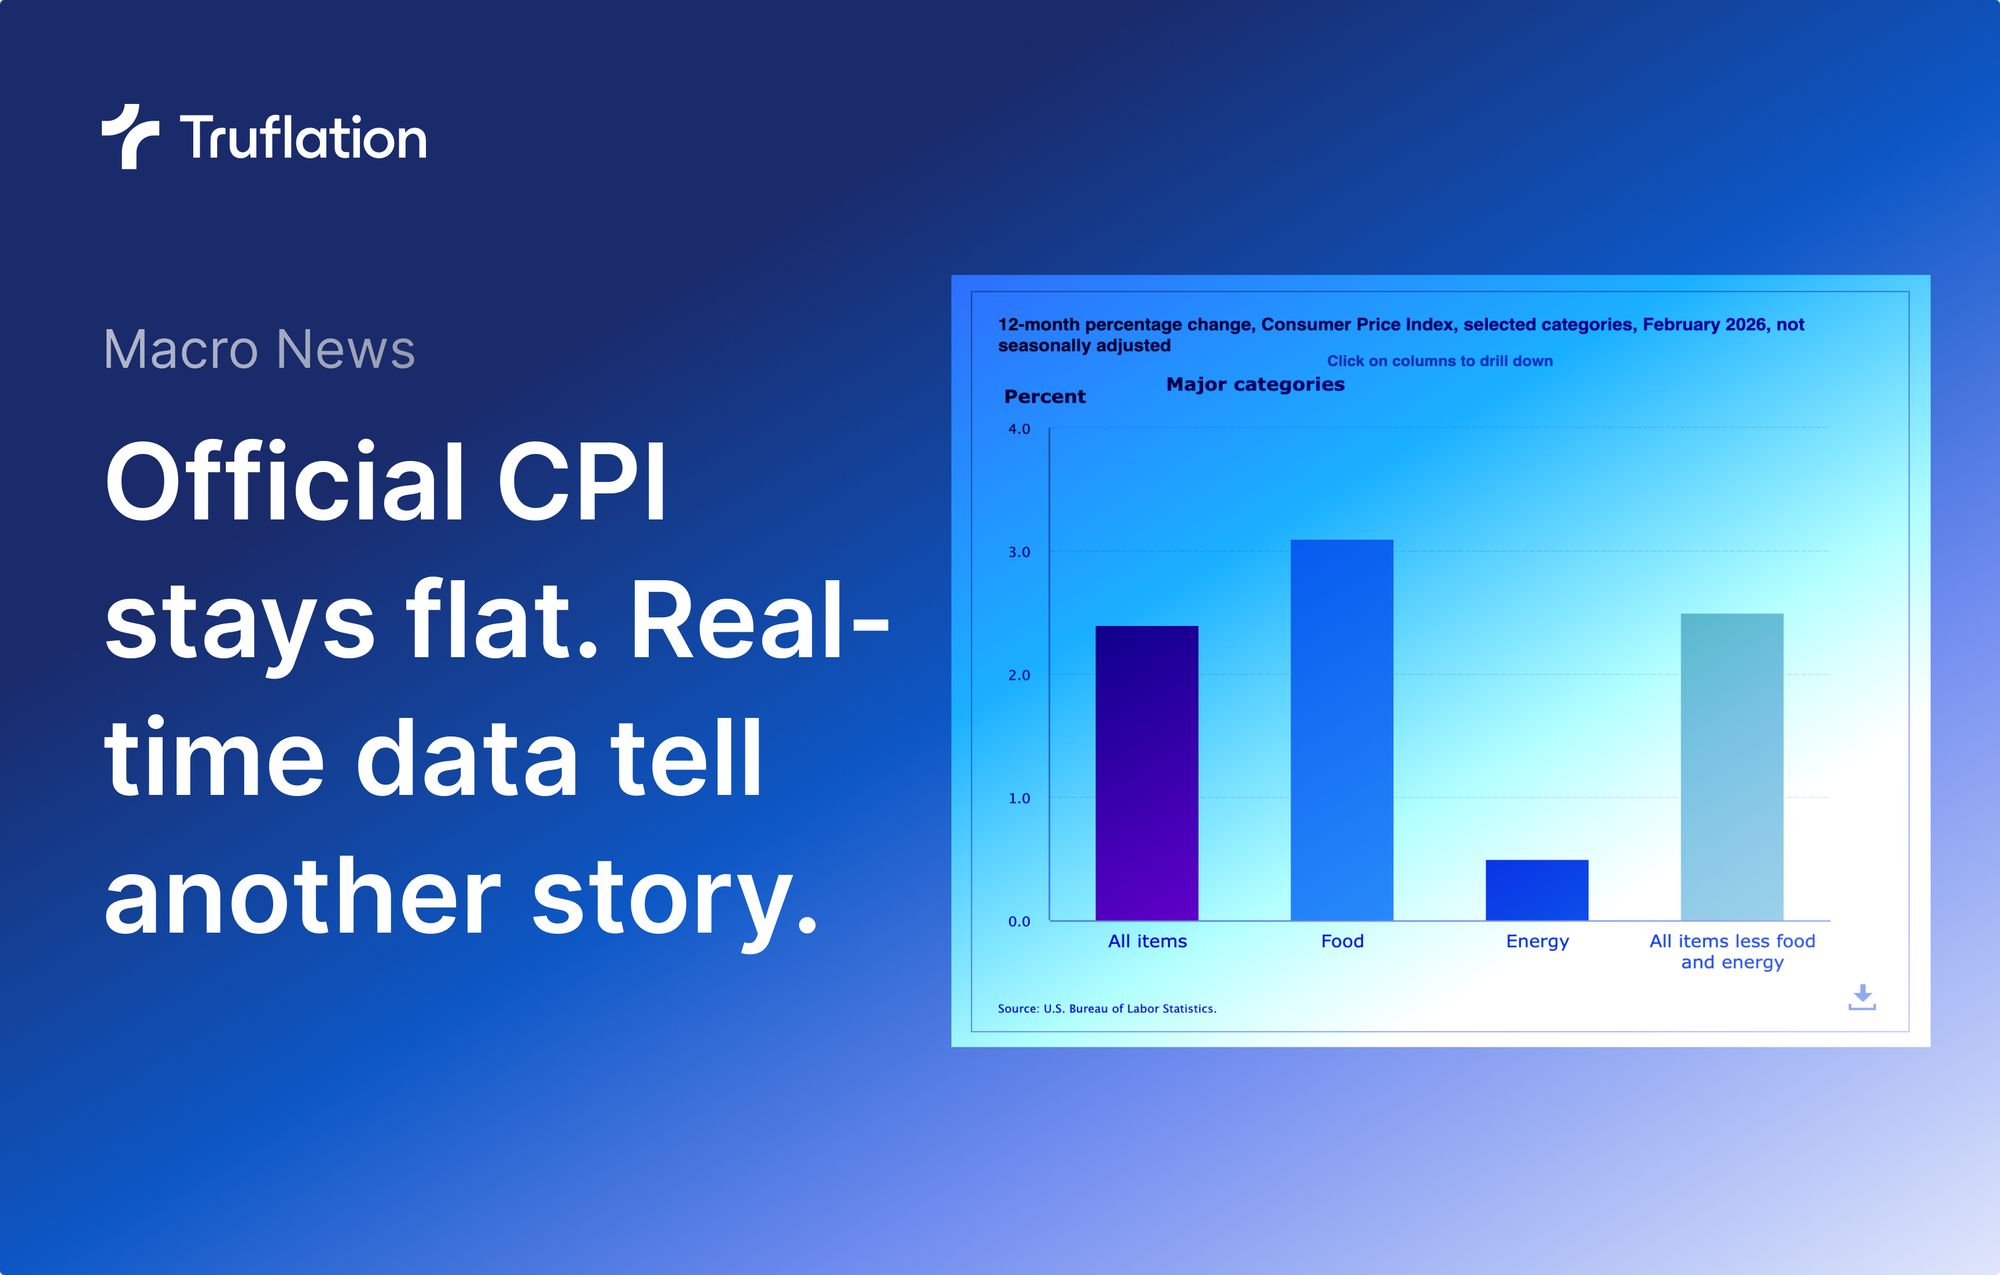
Official February CPI comes in flat. Real-time data tells another story.
Truflation Newsletter
March 11, the US Bureau of Labor Statistics released its lagging CPI, which came at 2.4% Y/Y for February, in line with our predictions and market consensus. February Core CPI came at 2.5%, also as predicted.
The official US CPI (headline inflation) comes in at 2.4%, correctly predicted by our data team, the same as in January and in line with market consensus.
— Truflation (@truflation) March 11, 2026
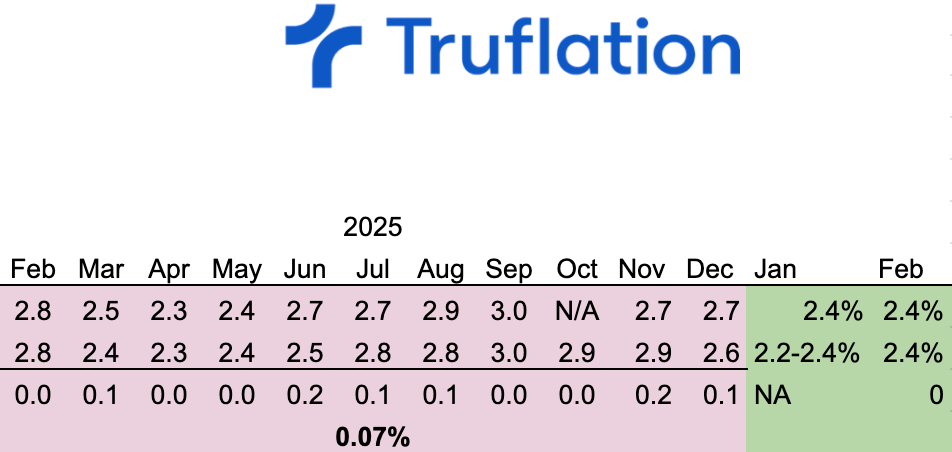
Our data forecast model again correctly predicted 2.4%. We reached this number by aging our data by about 45 days, mapping… pic.twitter.com/NSns6b2w9V
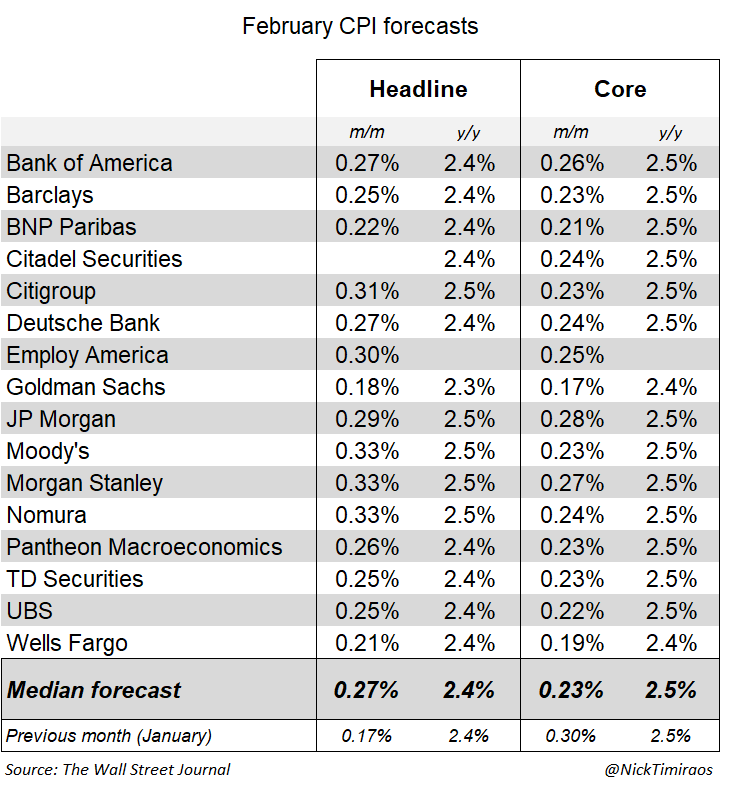
The public predictions ranged from 2.3% to 2.5%. Truflation's regression analysis model put our forecast smack in the middle at 2.4% and we were right, again.
Truflation's predictions of the BLS CPI are released monthly with our Inflation reports and available ahead of the official numbers for our subscribers. In January 2026, we predicted a range of 2.2-2.4% and a significant inflation cooling that surprised the markets when even the best commercial predictions came in much higher. The official CPI for January was 2.4%.
BREAKING: Official US CPI comes at 2.4% Y/Y
— Truflation (@truflation) February 13, 2026
Truflation correctly predicted the numbers would come in cooler than the market consensus of 2.5%, between 2.2% and 2.4%, when we extrapolate our rapidly cooling numbers to the BLS CPI. pic.twitter.com/XSGX9RXpz7
Real-time price data is showing rapidly changing dynamics.
Recently, we've seen volatility in our daily data and even received some unwarranted criticism about higher background noise. Some volatility is quite normal because our index is a daily year-over-year rate change.
Volatility is also welcomed since it can show important fluctuations that help predict future trends and alpha. However, we rarely see it at this scale, and affecting all of the categories and subcategories with different components, significantly cooling whole other categories are heating up.
- Jan/Feb - we saw abrupt and significant cooling across multiple categories: housing, especially rents, food, goods, clothing, utilities, transport, and communications.
- Feb 28 - significant drop in housing, especially rents and other lodgings, utilities, especially natural gas, transport, mostly vehicle purchases, and food at home.
- March 6 - significant decrease in rent prices, but partly offset by rising prices of food and transport, mainly gasoline.
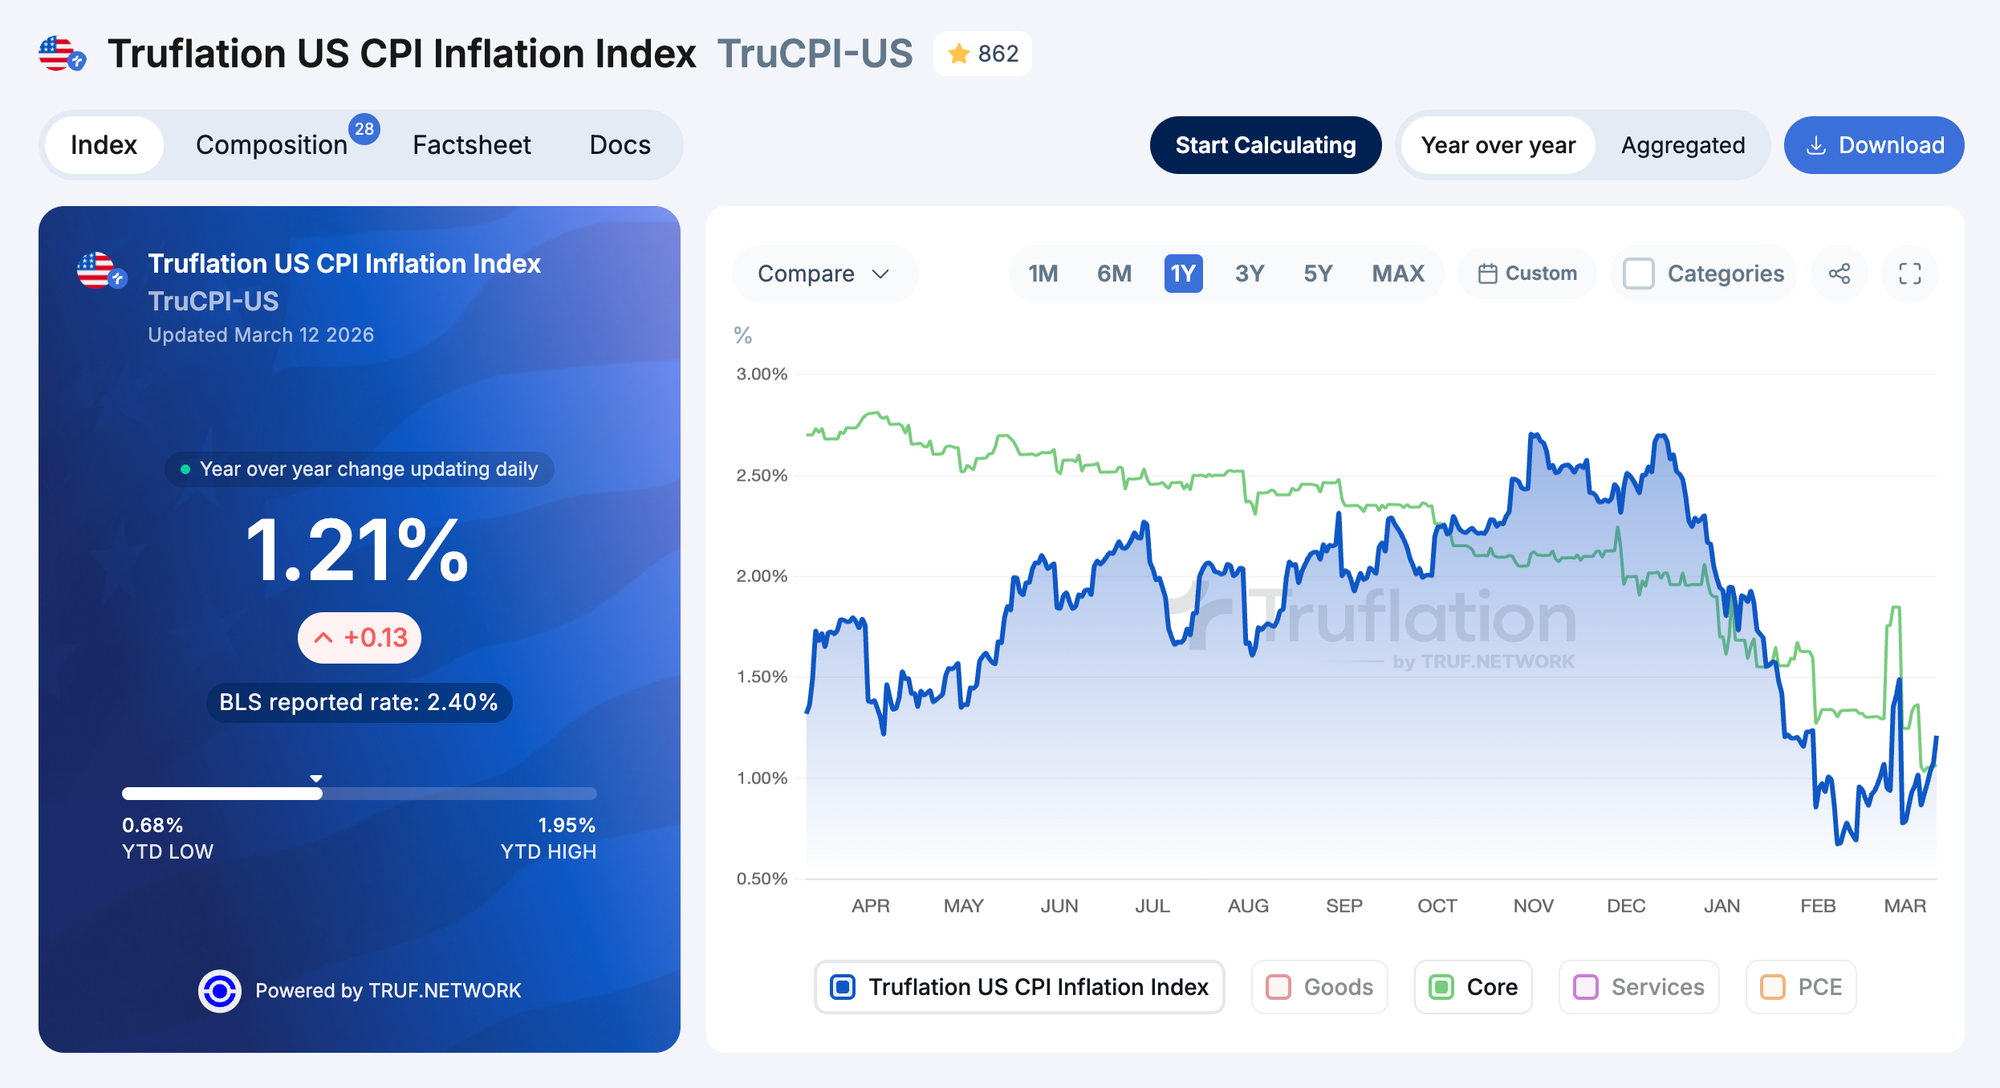
- March 12 - a significant 0.13% increase solely due to a 5.7% spike in gasoline prices following the oil prices (~$95 per barrel)
- March 13 - Truflation US CPI jumped from 1.21% to 1.47% today, pushed upwards by multiple categories: clothing, transportation, household items, and housing, particularly short-term lodgings and hotels.
The quickly changing dynamics across multiple categories and their subcategories are quite alarming. It suggests some unprecedented and quite violent shifts are taking place and urges users to pay closer attention to the moving parts.
To that end, we made exploring Truflation insights easier and more accessible with free credits. Go check the composition tab in our US CPI index to explore categories and subcategories that are experiencing significant shifts right now.
Effects of Oil
The latest, biggest drive pushing inflation up at an alarming speed is the war in Iran, affecting global prices of oil. Last week, crude oil prices went up to $110 per barrel before dropping slightly to ~$97 as of March 12, 2026.
This drove a massive increase in the prices of gasoline at the pump. We registered a 5.7% increase on March 12 alone, which, with the gasoline impact on our CPI of about 3.2%, resulted in a 0.13% shift in Truflation's headline inflation. One of our providers, the EIA, reported a 15% increase in average gasoline prices in a week.
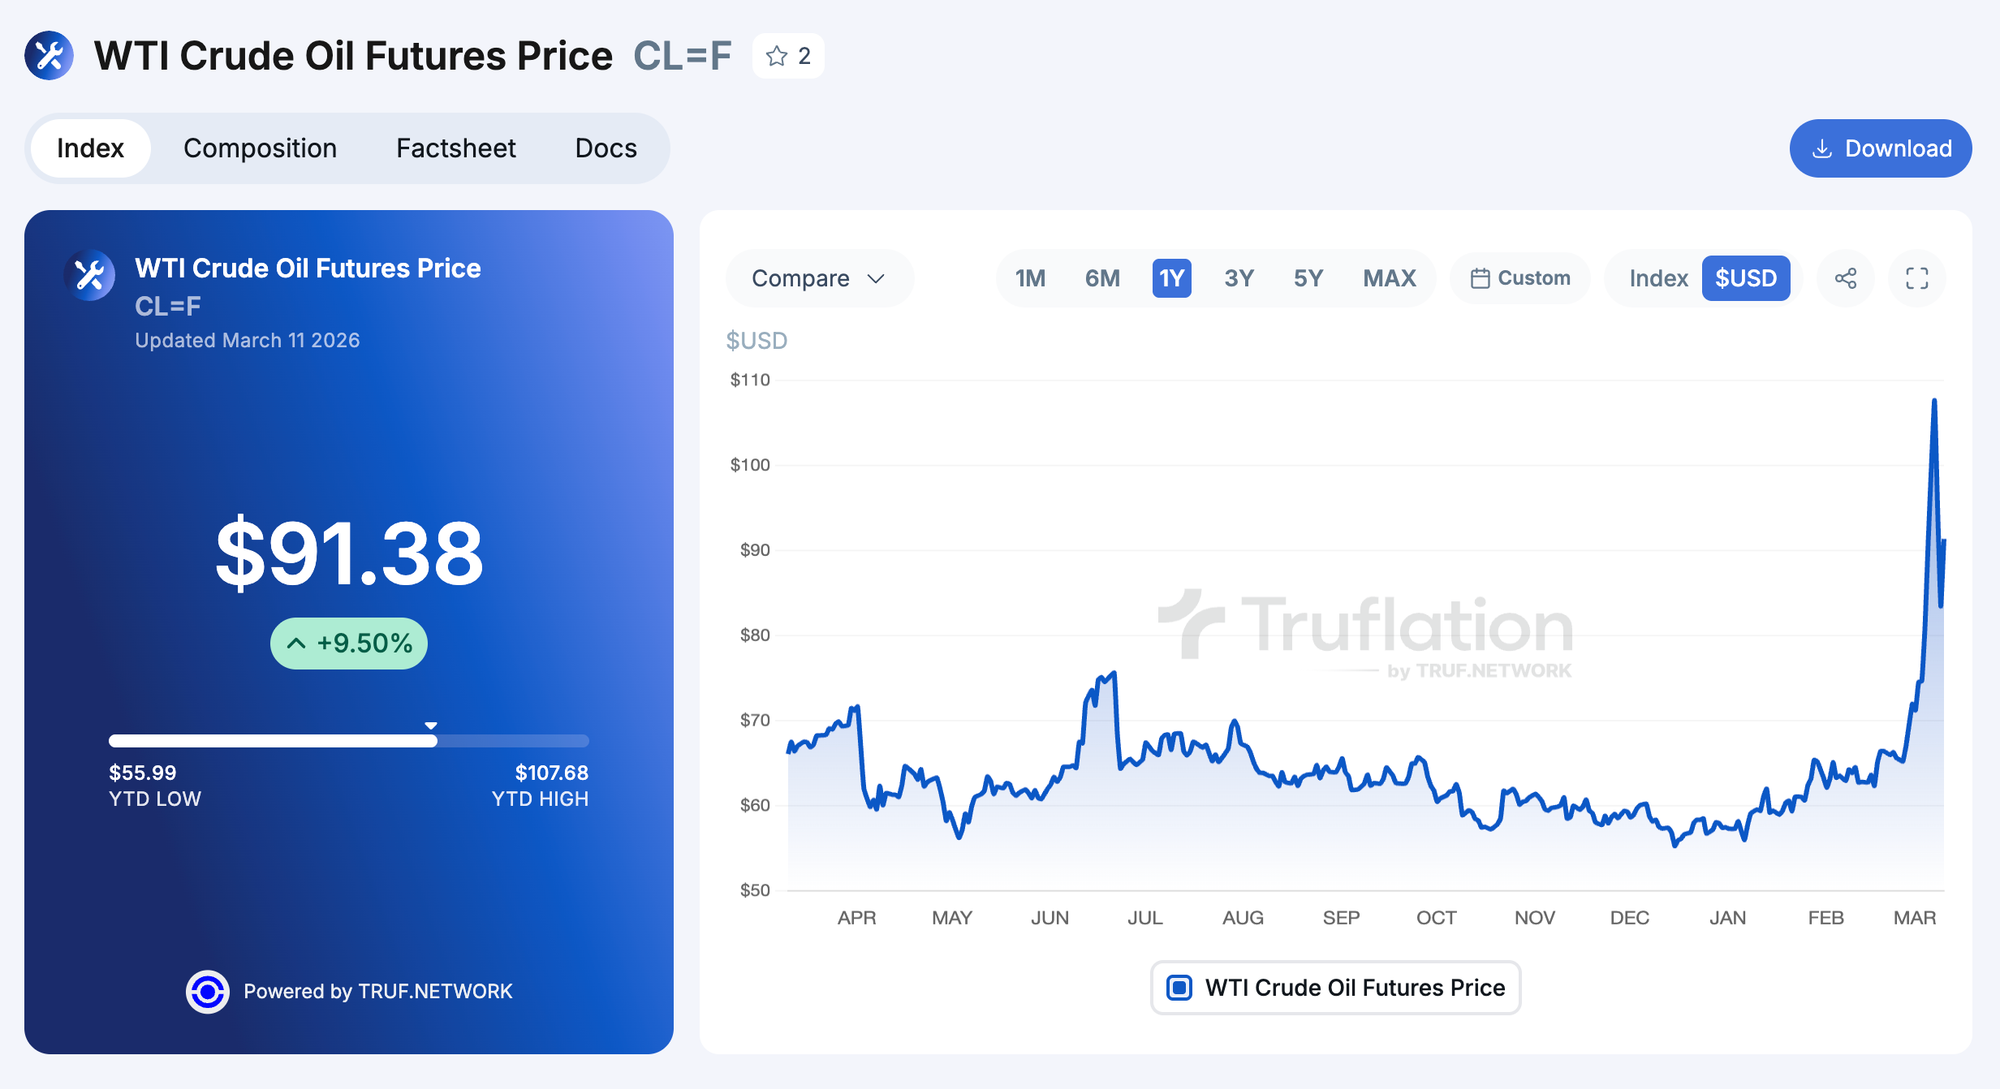
Crude oil prices have been on the rise since mid-January, and in February, exacerbated by the war in Iran. The price of WTI crude oil increased from $57 as of January 1st to ~$97 per barrel as of March 12.
The Middle East crisis also brought traffic through the Strait of Hormuz close to a standstill, with Qatar’s Energy Minister warning that crude oil prices could reach $150 per barrel if oil tankers are not able to pass.
Thanks to our data, it's also possible to see in real time how unexpectedly fast the oil commodity prices are being transferred directly onto the consumer at the pump, and changing the headline inflation number. Whether this effect remains sticky in the long-term will depend on how long the conflict and shipping constraints last.
We discussed some of the effects of this oil uncertainty on our latest CPI spaces with renowned economists and fund managers, Daniel Lacalle and E.J. Antoni.
Listen to spaces:
Other potential effects of the conflict in the Middle East on inflation:
- Disruptions of the energy supply in Europe, which is likely to affect food production and imported food prices
- Increase in shipping costs affecting goods and food
- Cost of fertilizers and other byproducts of the oil industry
- Consumer utilities when the volatile commodity prices are transferred onto end consumers, who are currently still protected by their latest supplier contracts
More this week
Tune in tomorrow, March 13, for the official BEA release of the PCE inflation for January. BEA releases its laggy data with even more delays than the BLS, but remains the Fed's preferred gauge of US inflation.
Official BEA PCE inflation for January(!) is coming out this Friday, Mar 13, ahead of the FOMC meeting next week.
— Truflation (@truflation) March 11, 2026
Last PCE and Core PCE surprised to the upside:
- BEA PCE: 2.9% (up from 2.8%)
- BEA Core PCE: 3% (up from 2.8%)
We obtain an alternative daily PCE index by mapping… pic.twitter.com/DTdBtg95V9
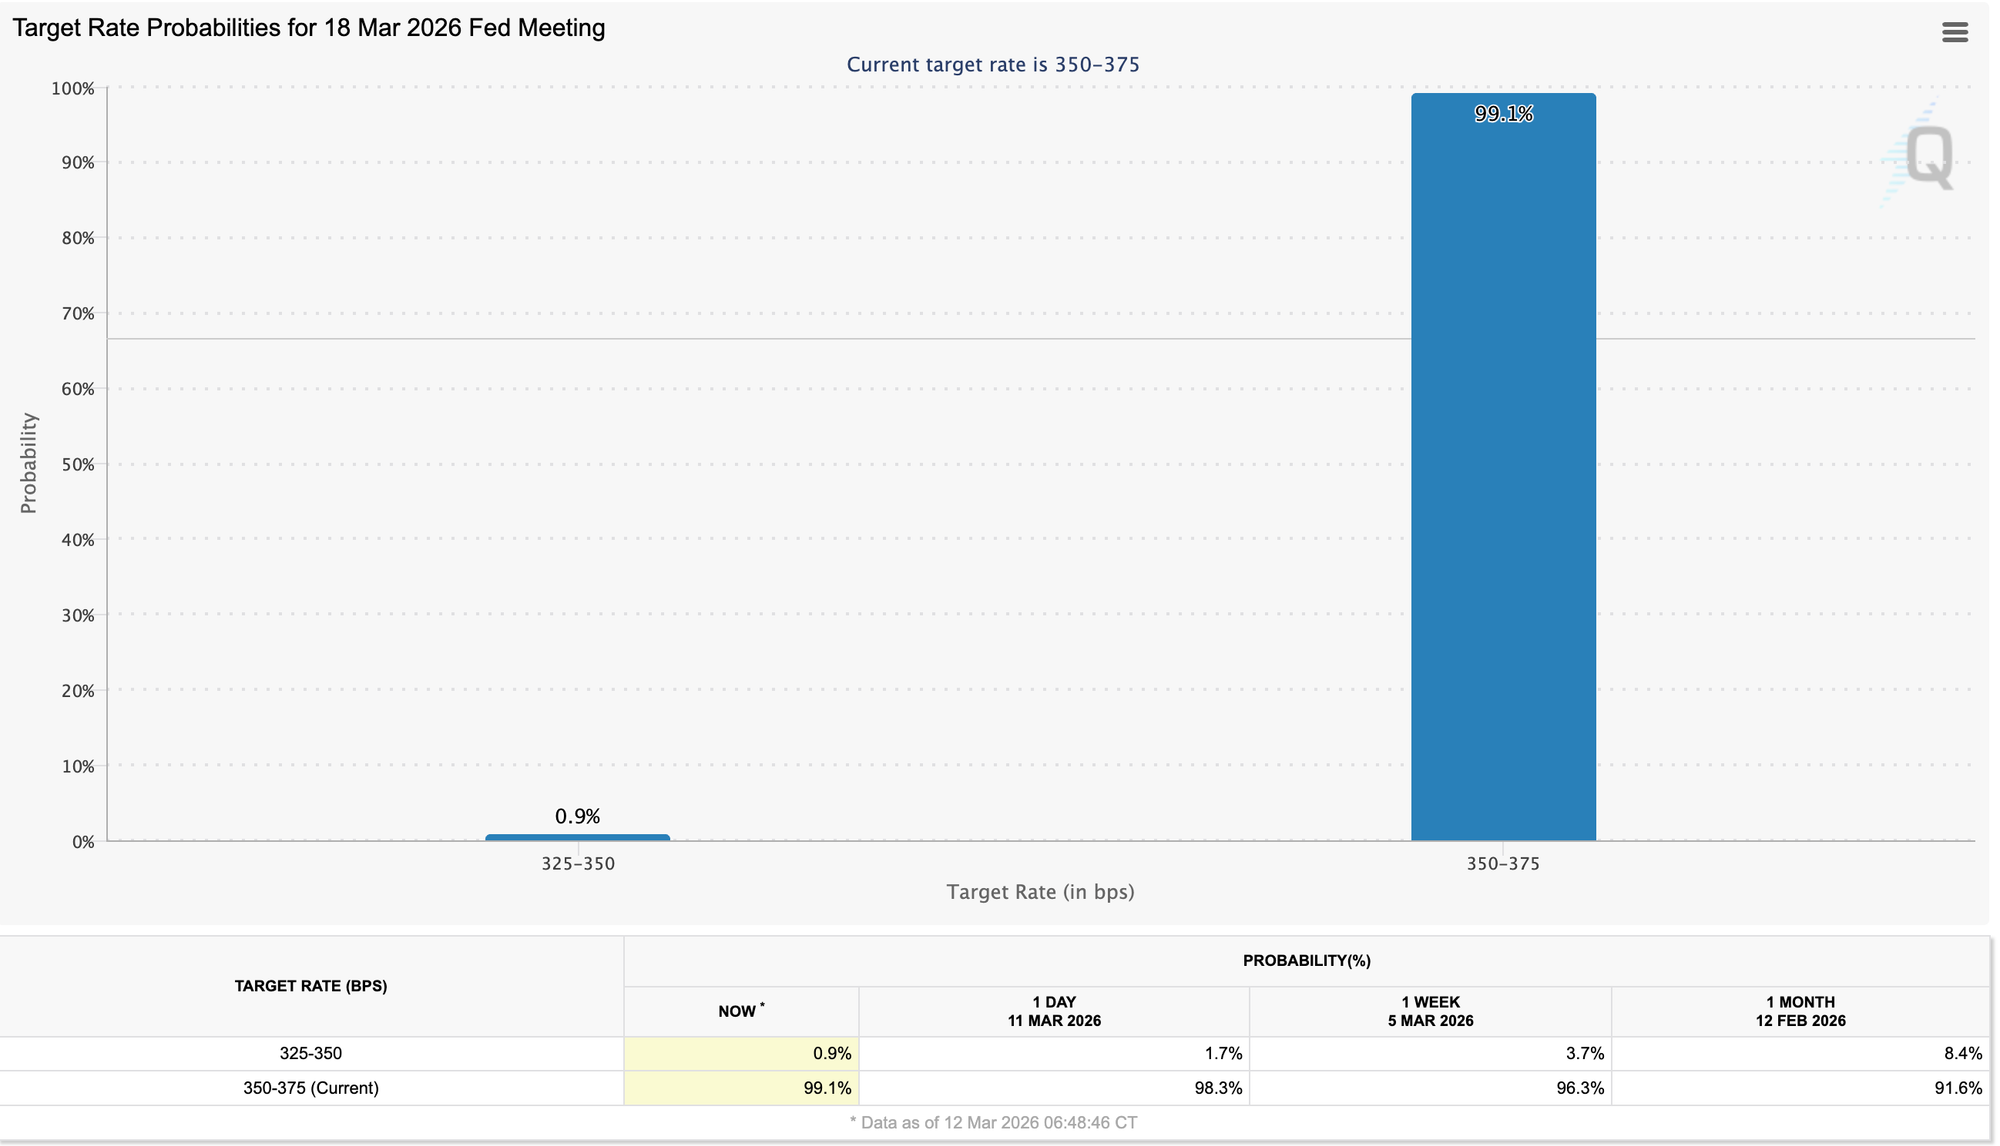
Also, next week, we'll have another FOMC meeting. Markets are not expecting any new rate cuts this time nor anytime soon. Especially after the unexpectedly hot December PCE data, a flat official February CPI, and still fairly stable labor data. This meeting will be mainly observed for estimates about the size and number of future cuts. Major commercial bank analysts forecast only 0-3 cuts of 0-75 bps for the whole of 2026.
They are talking about us
On the subject of cuts, Antony Pompliano has been a long-term proponent calling for aggressive interest rate cuts and warning of strong disinflation and even deflation that we see in Truflation data and the huge effect the current interest rates have on the US debt. He recently sat with Phil Rosen to discuss rates and Truflation data, suggesting the BLS data might be politicized.
.@APompliano mentions Truflation in an interview with @philrosenn and suggests the official BLS CPI data could be politicised.
— Truflation (@truflation) March 11, 2026
What do you think? https://t.co/VbqXrMyoGg