Truflation Releases Updated 2026 CPI Weights to Match Consumer Expenditures
The Truflation Data Team just released our annual CPI weighting update. The new relative importance weights for the 2026 TruCPI-US Inflation Index are derived from 2025 household spending patterns, ensuring the index continues to mirror actual consumer spending with precision and timeliness.
Implications for Market Participants
These recalibrated weights offer actionable intelligence:
- Macro analysts gain a more accurate real-time inflation signal for forecasting Fed policy and growth trajectories.
- Institutional investors can refine inflation-hedging strategies, sector allocations (e.g., healthcare, utilities/energy, consumer staples), and duration positioning.
- Retail traders receive transparent, unbiased data to anticipate CPI surprises and volatility in rate-sensitive assets.
By staying closely aligned with actual household behavior, Truflation’s index provides a leading-edge complement to traditional measures, helping users separate signal from noise in 2026’s economic outlook.
What are the Truflation CPI Weight Changes for 2026
The overall shift between our weights in 2025 and 2026 remains modest, as expected in a mature consumption basket, yet several categories show statistically and economically meaningful movements:
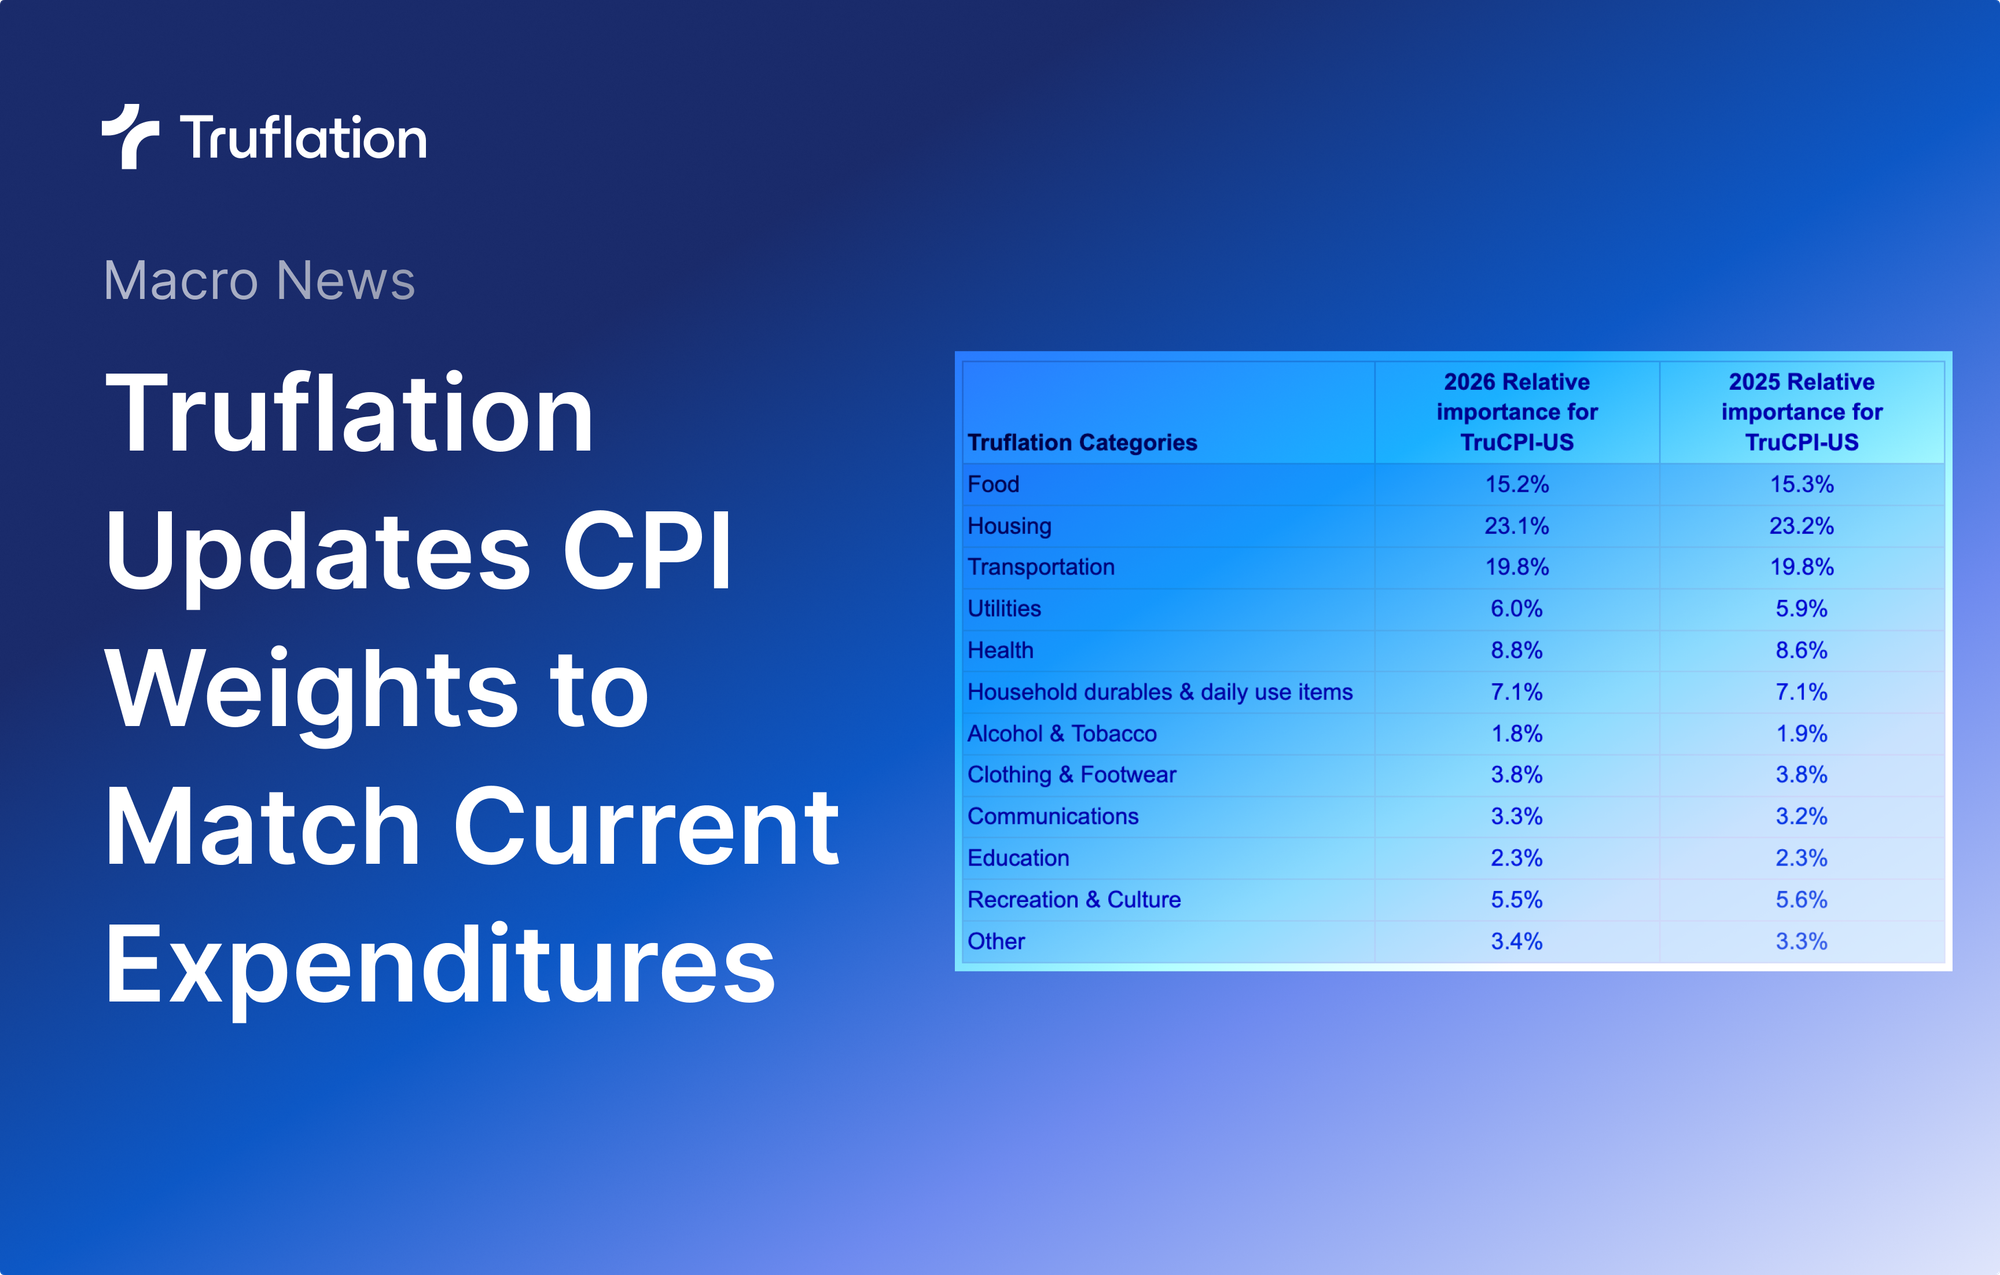
| Truflation Category | 2026 Relative Importance | 2025 Relative Importance | Change |
|---|---|---|---|
| Food | 15.2% | 15.3% | -0.1% |
| Housing | 23.1% | 23.2% | -0.1% |
| Transportation | 19.8% | 19.8% | 0.0% |
| Utilities | 6.0% | 5.9% | +0.1% |
| Health | 8.8% | 8.6% | +0.2% |
| Household durables & daily use items | 7.1% | 7.1% | 0.0% |
| Alcohol & Tobacco | 1.8% | 1.9% | -0.1% |
| Clothing & Footwear | 3.8% | 3.8% | 0.0% |
| Communications | 3.3% | 3.2% | +0.1% |
| Education | 2.3% | 2.3% | 0.0% |
| Recreation & Culture | 5.5% | 5.6% | -0.1% |
| Other | 3.4% | 3.3% | +0.1% |
Notable Drivers Behind the Shifts
- Food (15.3% → 15.2%): Consumers continued shifting from dining out to at-home preparation; food-at-home gained share partly from tariff effects and sustained preference for home cooking.
- Housing (23.2% → 23.1%): Rental costs eased due to increased housing supply and landlord incentives (e.g., rent-free periods). Owned dwellings saw relative relief from lower 2025 mortgage rates and income growth outpacing nominal prices.
- Utilities (5.9% → 6.0%): The rise is driven primarily by surging electricity demand from energy-intensive AI data centers, ongoing grid modernization, natural-gas volatility, and related policy adjustments — effectively a partial household subsidy to tech infrastructure expansion.
- Health (8.6% → 8.8%): Largest single increase, fueled by higher service utilization, persistent medical inflation, rising insurance premiums, and labor costs — a clear post-pandemic normalization trend.
- Alcohol & Tobacco (1.9% → 1.8%): Ongoing secular decline in tobacco use coupled with modest generational reduction in alcohol consumption.
What's the overall impact on the Truflation's headline inflation?
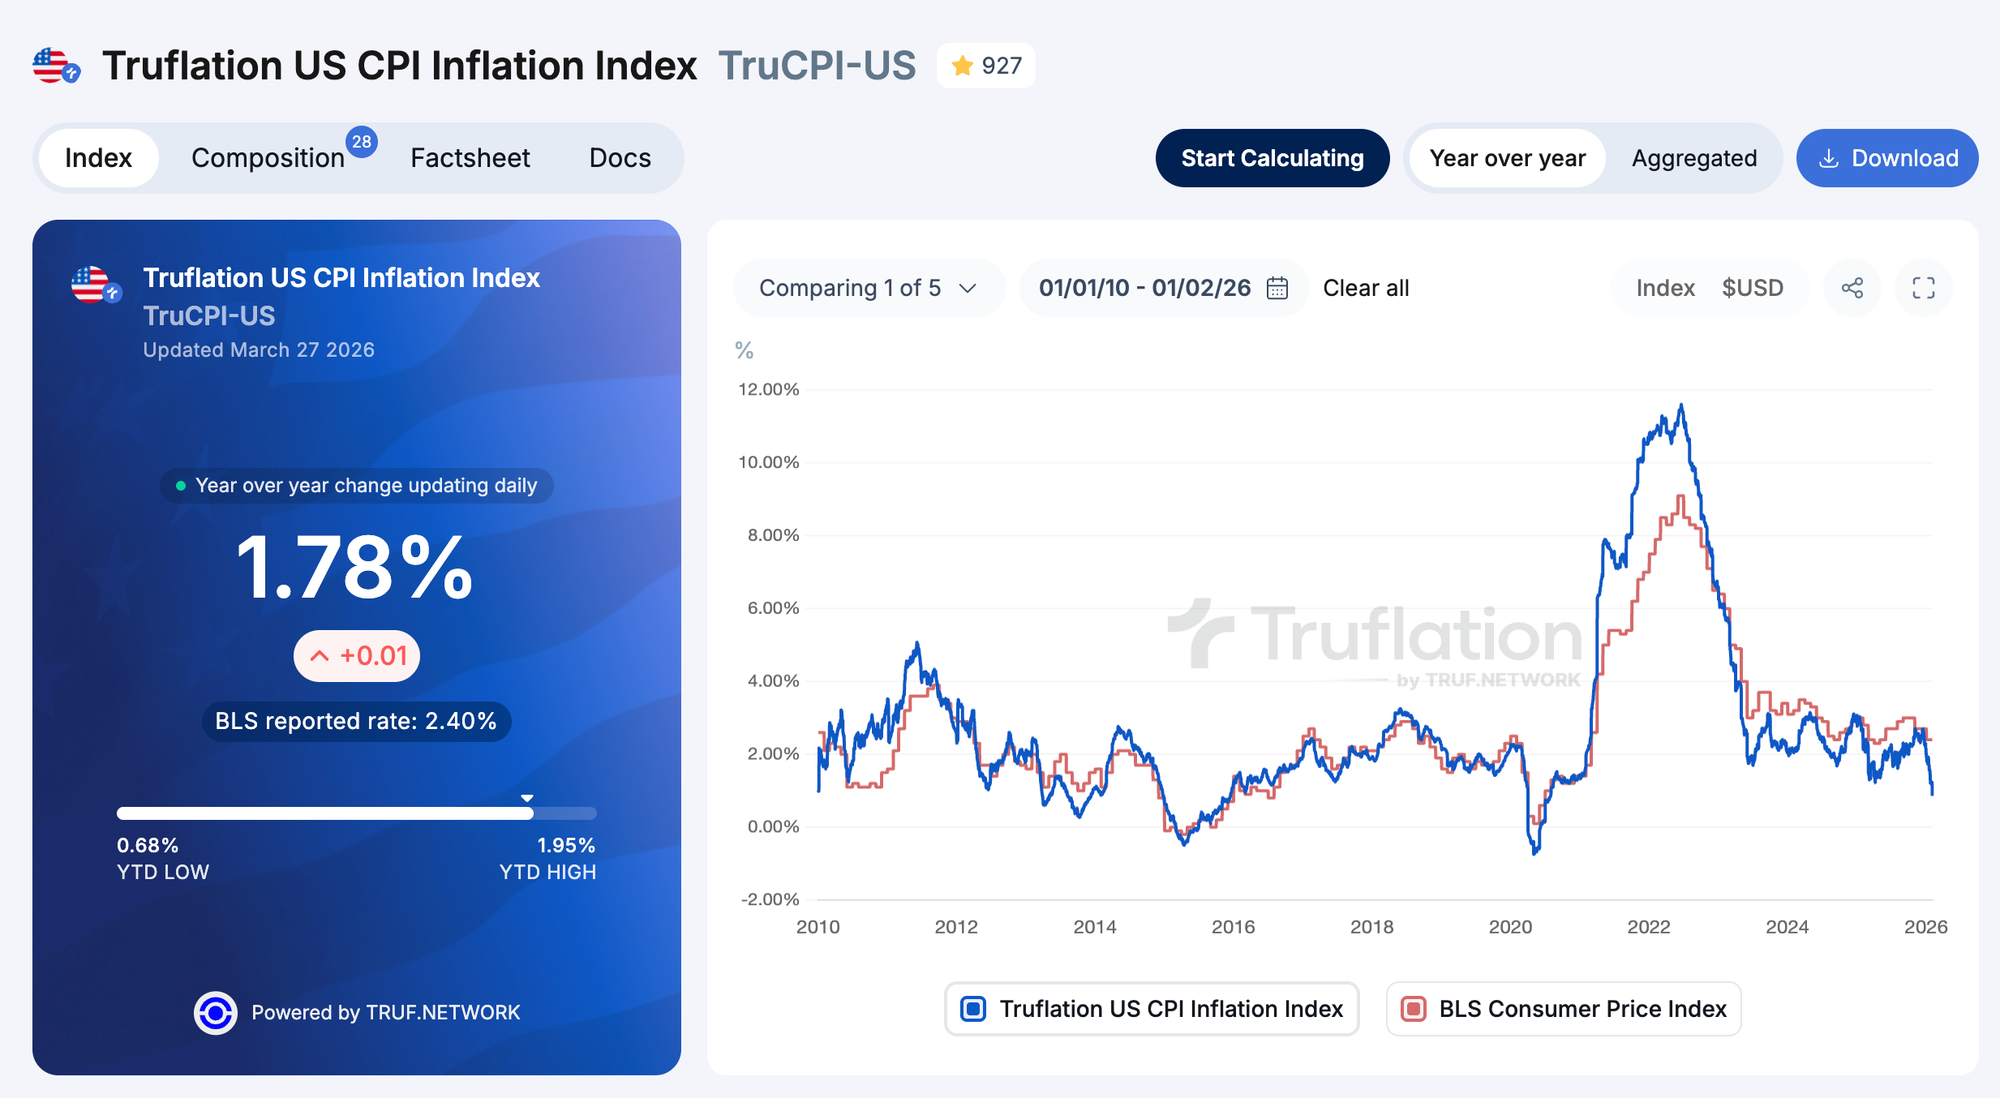
Despite some interesting shifts in CPI categories and subcategories, which help deepen analyses of the crucial drivers of inflation, the latest consumer expenditures show low impact on the main inflation numbers of less than 0.01% today and, on average, 0.0003% since the start of the index (2009), with maximum divergence registered at ±0.024%.
Where are the CPI relative importance weights derived from?
The household expenditure is derived from multiple independent data sources to ensure robustness, neutrality, and resilience against bias. The sources used to calculate the relative importance include credit card transaction data, Census data, and household expenditure data from Global Demographics, NielsenIQ, and government statistical agencies. These inputs are subsequently validated against Truflation’s proprietary data feeds, Truflation inflation calculators, and additional third-party sources, such as retail sales data and mortgage spending datasets. The outcome is that Truflation produces a comprehensive and unbiased representation of consumer spending behavior.
What's the difference between Truflation and BLS CPI weights?
Truflation CPI weights are updated annually using household expenditures from the prior year, i.e., the newly released 2026 Truflation CPI weights are based on 2025 consumer spending habits from multiple different providers and types of data sources, as mentioned above.
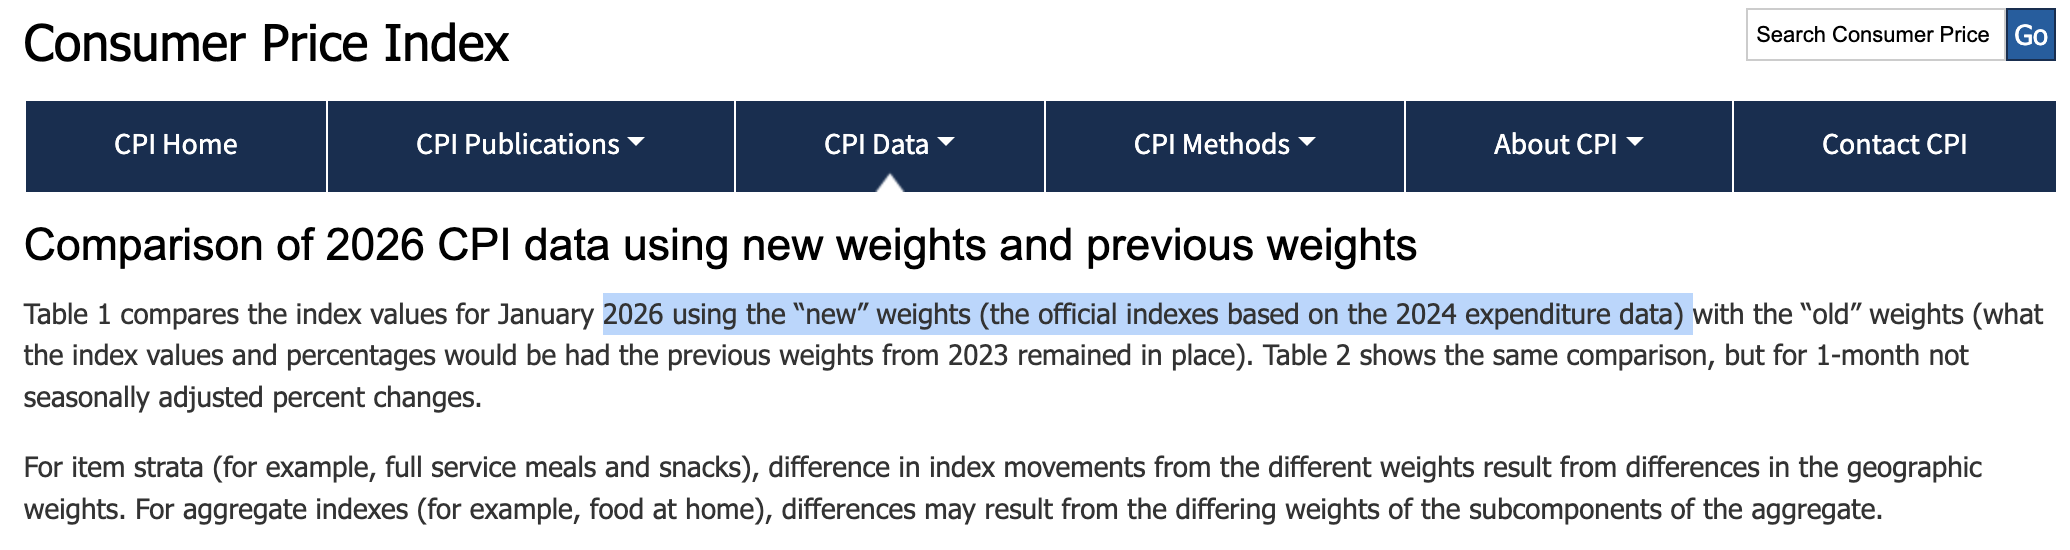
Meanwhile, the BLS CPI weights, which, since 2023, are also updated annually, are based on 24-month-old expenditure data; for instance, the current 2026 BLS CPI uses weights from 2024 household surveys of consumer expenditures.
Truflation CPI weights differ from the BLS CPI weights not only because Truflation uses more diverse and current expenditure data, including actual transaction data, but also because it has a slightly different category and subcategory distribution than the BLS (some subcategories are assigned to different categories), which also shifts the (sub)category weights (see detailed CPI and Truflation weights in the Appendix).
In essence, Truflation and BLS CPIs are two different indices that aim to capture consumer inflation from different angles: Truflation emphasizes real-time, more precise transaction-driven data, while BLS CPI focuses on broader, smoother macroeconomic trends with less volatility and less reactivity to current market events. Truflation trend shifts have also been shown to lead the BLS CPI by 45 days and can be used to effectively predict the BLS CPI through regression analysis.
Conclusion
At Truflation, we remain steadfast in our mission to deliver the most accurate, transparent, and timely inflation intelligence. The 2026 weights underscore our commitment to data neutrality and continuous improvement.
Explore the full dataset, updated index series, and interactive tools at truflation.com. We welcome questions and collaboration from the investment and research community.
Stay ahead of inflation. Follow Truflation for ongoing macro insights.
APPENDIX
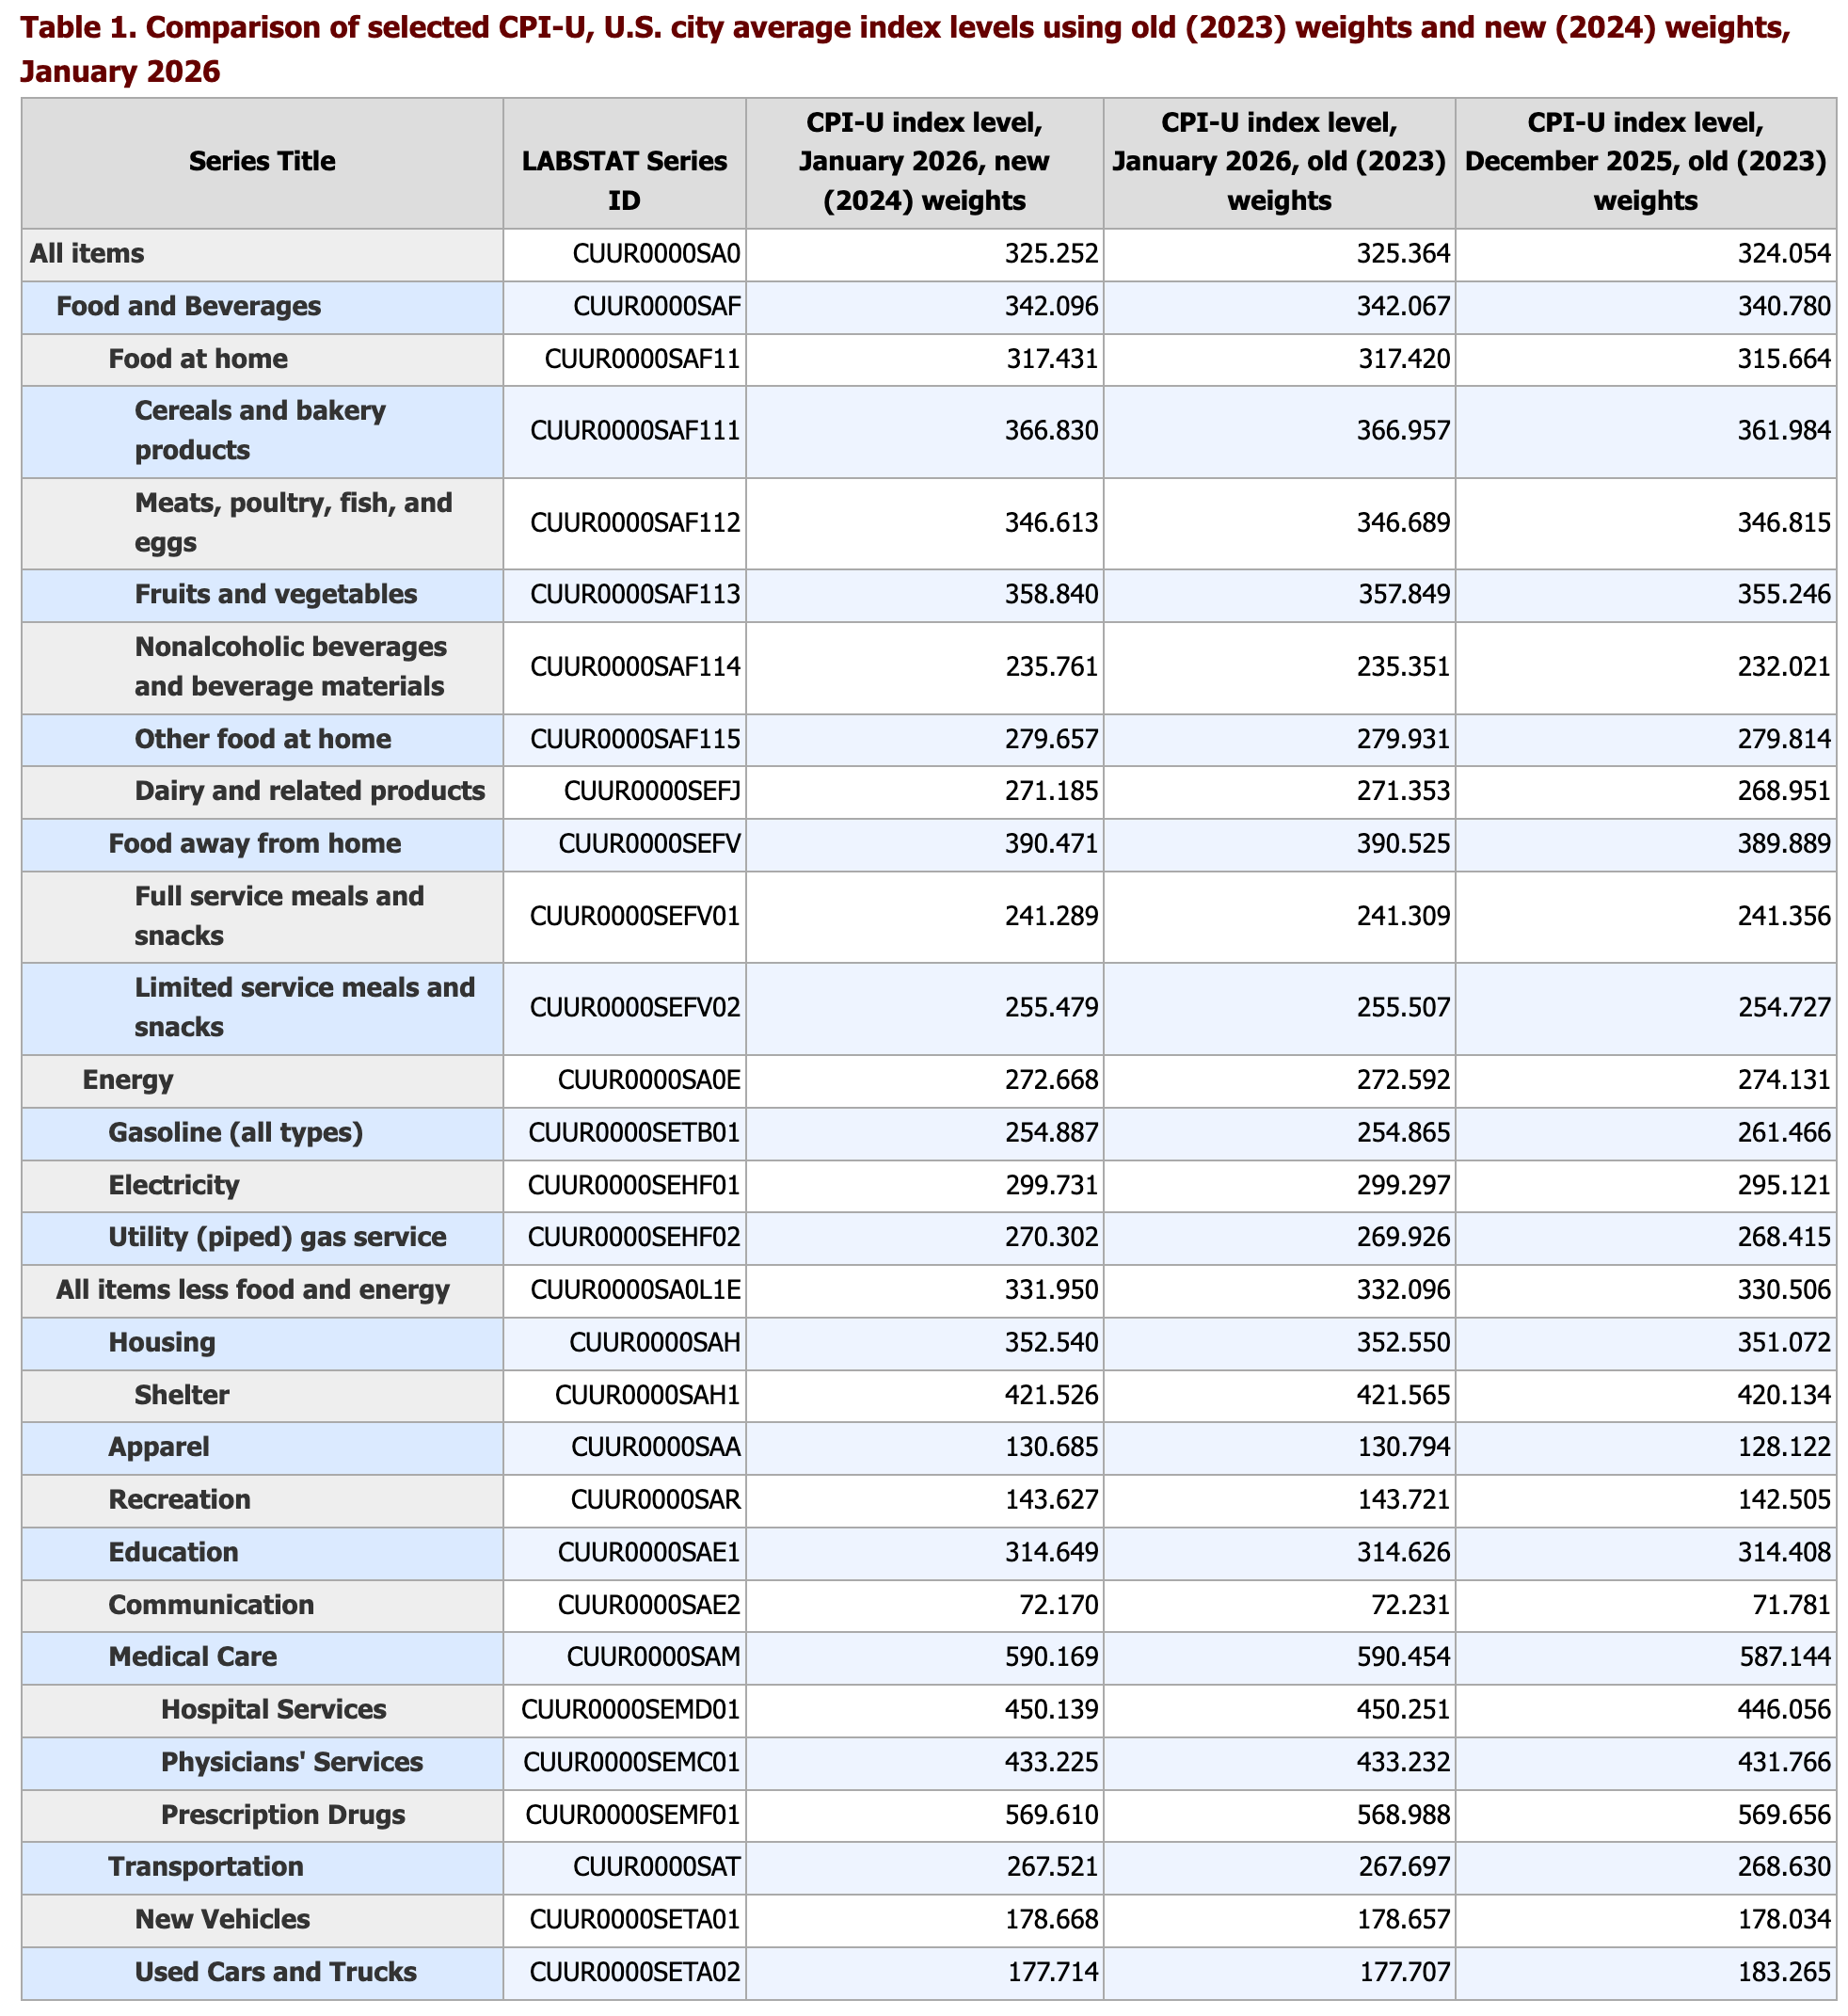
Appendix Table 1: Detailed CPI Relative Importance Weights, New vs Previous, updated March 26, 2026
Appendix Table 2: The BLS CPI weights were updated in January 2026, affecting the January 2026 inflation data, released on February 13.