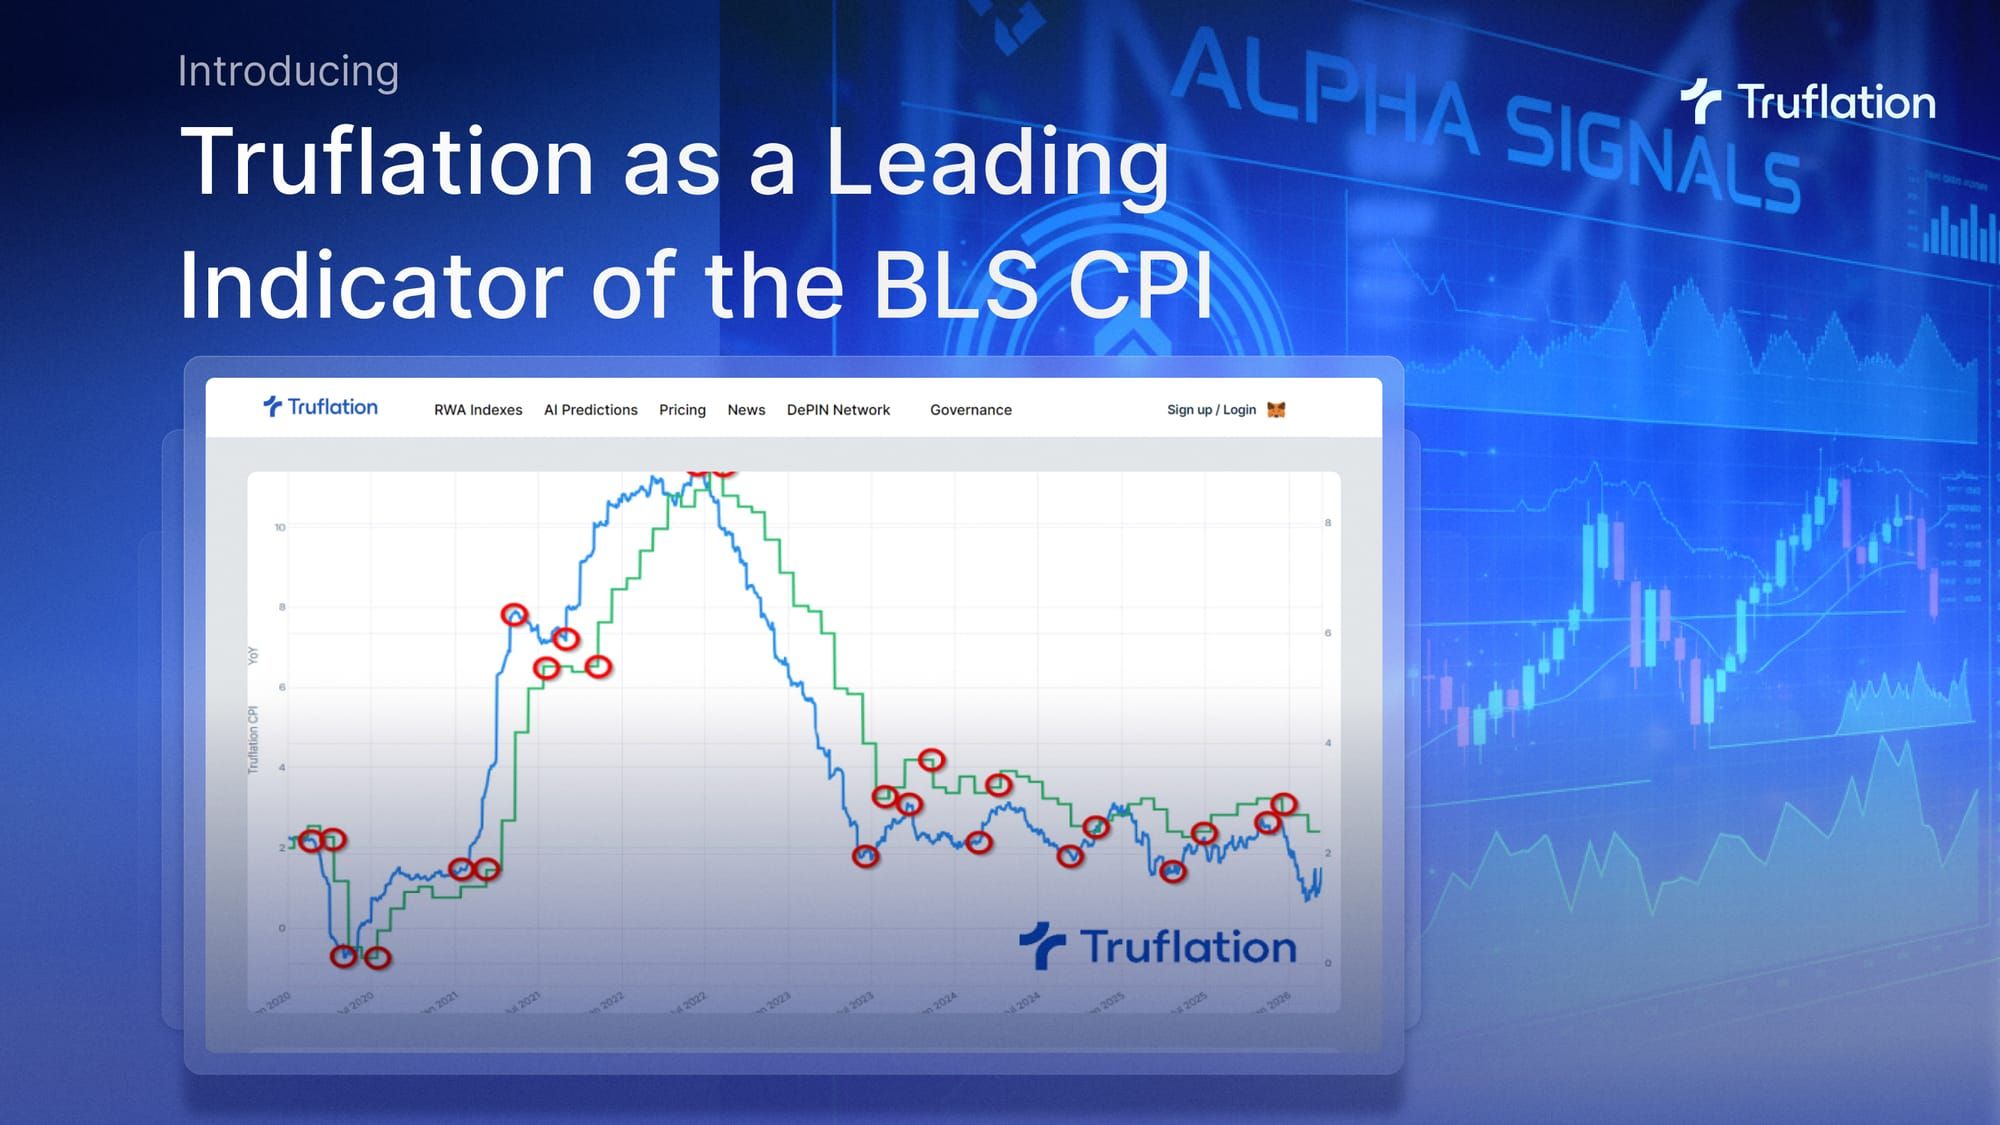
Truflation as a Leading Indicator of the Official BLS CPI Inflation Measure

This is an updated report based on the latest regression analysis by the Truflation data team.
1. Introduction
Truflation provides a high-frequency, data-driven measure of inflation designed to reflect real-time price dynamics across the economy. Traditional measures such as the Consumer Price Index (CPI), published by the U.S Bureau of Labor Statistics (BLS), remain the official benchmark; however, they are structurally backward-looking due to:
- Monthly data collection cycles
- Survey-based methodologies with manual price checks
- Publication lags in the reporting schedule
These characteristics introduce a systematic information delay for policymakers, investors and risk managers. Truflation addresses this limitation by aggregating over 15 million price points across 30+ data sources, producing a daily inflation index that reflects current market conditions.
A consistent empirical observation is that Truflation not only tracks CPI closely but systematically leads it. This paper formalizes that relationship through statistical analysis across distinct macroeconomic regimes.
2. Key Differences in Methodology
The Bureau of Labor Statistics, Consumer Price Index, aims to measure price changes across a representative basket of goods and services. However, there are fundamental differences between CPI and Truflation in data coverage, timeliness, and calculation methodology:
- Update Frequency: CPI is released monthly, providing a retrospective view. Truflation updates daily, capturing inflation shifts in real time.
- Data Sources: CPI relies on ~80,000 sampled price observations and a rotational housing survey. Truflation aggregates more than 15 million real-time observations from both public and private datasets, enabling faster detection of market changes.
- Calculation Approach: CPI incorporates modeled adjustments such as substitution effects and hedonic quality adjustments. Truflation uses large-scale, transaction-level data, allowing market behavior to be reflected directly without reliance on imputation.
- Housing Measurement: CPI uses Owner’s Equivalent Rent (OER), an imputed estimate based on surveys conducted semiannually. Truflation models actual housing costs, incorporating mortgage rates, home prices and transaction data for a more direct representation.
- Data Finality: Truflation publishes “frozen” values that are not revised, ensuring consistency and reliability for real-time decision making.
3. Data and Analytical Methodology
The analysis compares the year-on-year percentage change of the Truflation U.S. CPI Inflation index and the CPI published by the U.S. Bureau of Labor Statistics, covering the period from January 2011 to February 2026.
To ensure comparability, differences in the data frequency between the two series must be reconciled through temporal aggregation. Specifically, Truflation’s daily observations are aggregated to a monthly frequency to align with the lower frequency BLS CPI data.
To quantify the lead-lag relationship, a Pearson correlation-based time series analysis is employed, using cross-correlation to identify the temporal offset between the two series. Aggregating Truflation data to a monthly frequency ensures that both datasets contain the same number of observations, enabling robust statistical comparison.
In addition, CPI data is aligned to its official release dates rather than the reference month. For example, the CPI value for January 2026 is assigned to its publication date of February 13, 2026. This treatment reflects the actual timing of information availability to market participants and accounts for the absence of a precise observation date within the reference month. As a result, the analysis captures the effective real-time informational lag embedded in the CPI release process.
For the lag analysis, a shifted Truflation series is constructed by systematically delaying the index across the range of intervals. At each shift, the correlation coefficient is calculated against the corresponding CPI values. This process produces a correlation profile across time offsets, allowing for the identification of the lag at which the relationship between Truflation and BLS CPI is strongest.
4. Results
The chart in Exhibit 1 plots the monthly CPI data published by the U.S. Bureau of Labor Statistics alongside both the daily Truflation U.S. CPI Inflation Index and its aggregated monthly equivalent.
Exhibit 1: BLS CPI YoY vs. TruCPI-US (Daily and Monthly Aggregated)
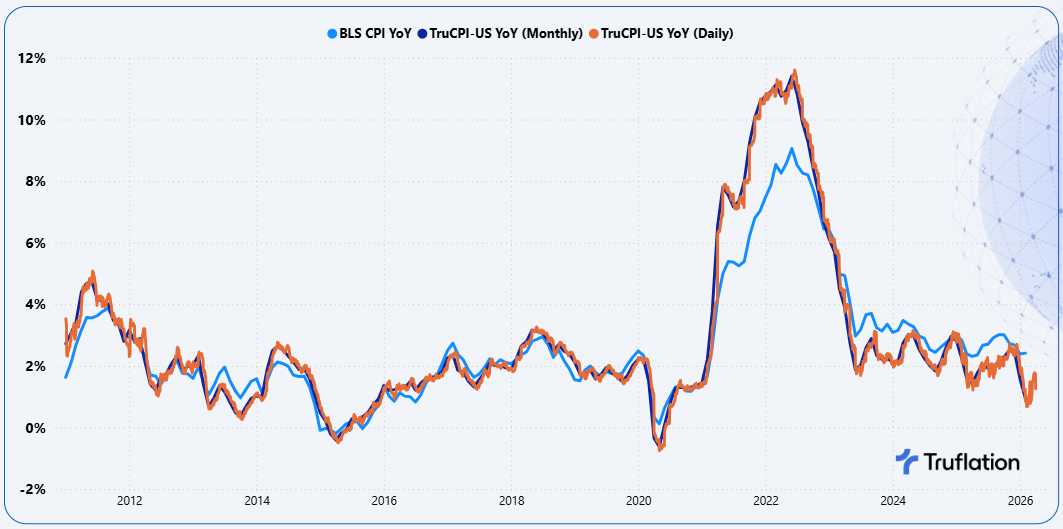
Visually, Truflation appears to lead the CPI series. Peaks, troughs and turning points in inflation are observed earlier in the Truflation data, supporting the view that Truflation functions as a leading indicator.
To quantify this relationship, a linear regression analysis was conducted, with TruCPI-US as the independent variable and BLS CPI as the dependent variable. Over the period from January 2011 to February 2026, the resulting correlation coefficient is 0.955, indicating an exceptionally strong positive relationship between the two series.
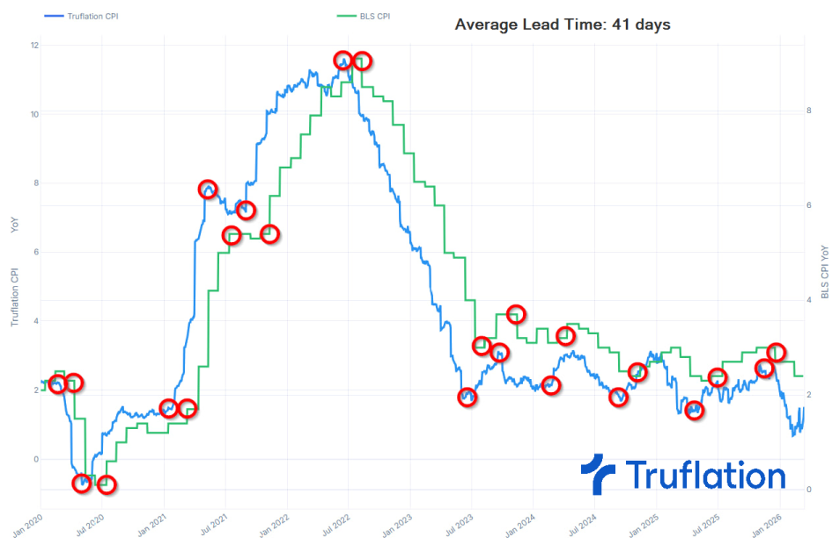
Cross-correlation analysis further refines this result. The highest cross correlation (0.962) is observed when Truflation is shifted forward by 41 days, implying a consistent lead of approximately six weeks relative to BLS CPI. This lead is structural rather than coincidental, reflecting fundamental differences in methodology, including data collection frequency, publication lags, and smoothing techniques.
Exhibit 2 illustrates this relationship by plotting BLS CPI alongside Truflation (both daily and monthly) shifted forward by 41 days.
Exhibit 2: BLS CPI YoY vs. TruCPI-US (Daily and Monthly) adjusted for a 41-day lead time
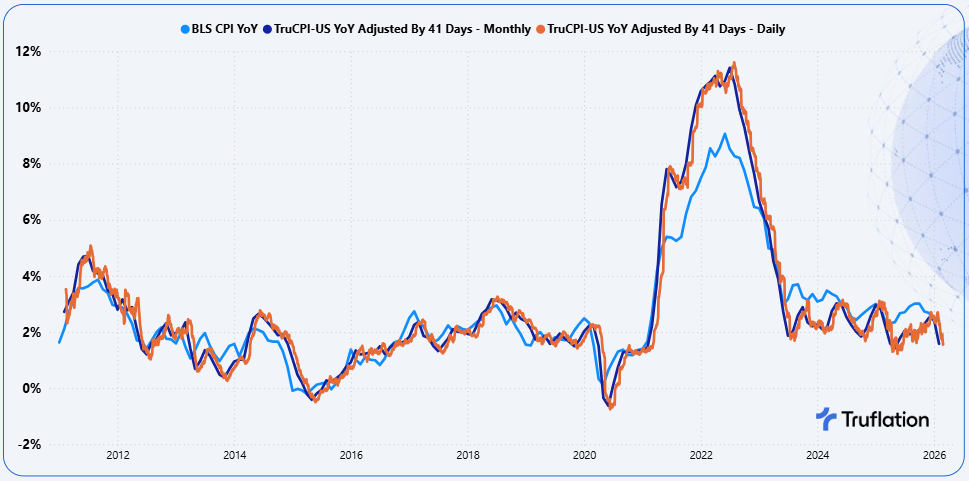
When adjusted for this lag, the correlation improves modestly to 0.962 (February 2011 to February 2026), further reinforcing Truflation’s role as a leading indicator.
However, these results should be interpreted with caution, as inflation dynamics vary significantly across the sample period. From 2010 through 2020, inflation was generally low, stable and often below the Federal Reserve target. In contrast, the period from 2021 to 2023 was highly atypical, characterized by stimulus-driven demand, supply chain disruptions, sharp increases in housing costs, and broad-based price volatility, followed by an unusually rapid disinflation phase. These shifts affected both the speed and transmission of price changes across the economy.
As a result, the full sample correlation reflects a mixture of heterogeneous inflation regimes rather than a single stable relationship. Segmenting the data reveals distinct regime-dependent lag structures, as shown in Exhibit 3.
Exhibit 3 - Segmented Inflation Periods
The longer lead observed during the high volatility period (~51 days) reflects the accelerated pace of price adjustments during inflation shocks, combined with the slower response of CPI due to its fixed sampling and smoothing processes. Consequently, the full sample peak does not represent a single structural lag, but rather an average across fundamentally different macroeconomic environments.
Regime Specific Correlation Analysis
To address the regime mixing effect observed in the full period analysis, the dataset is segmented into three distinct macroeconomic environments.
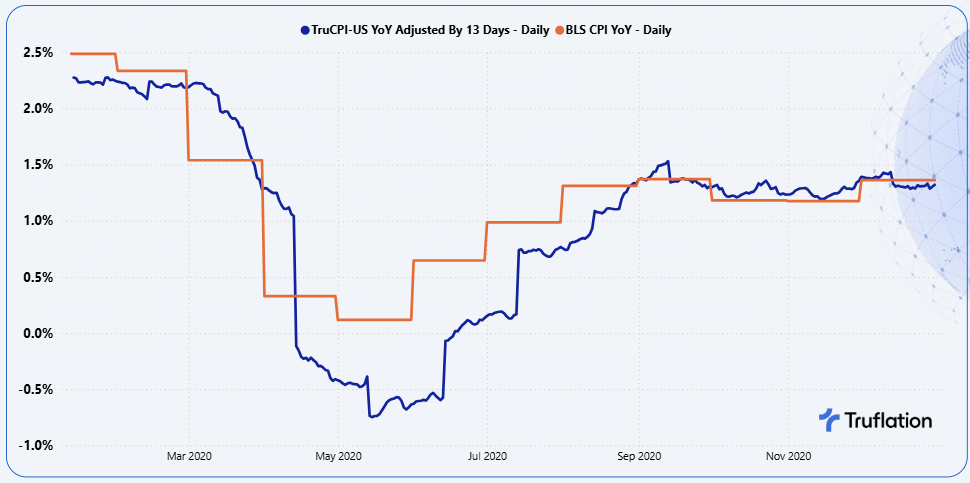
Low Consistent & Stable Inflation (January 1, 2020 - December 31, 2020)
In this period, inflation dynamics were relatively stable with gradual and infrequent price adjustments. As a result, movements in inflation were smooth and consistent.
When the TruCPI-US series is lagged by 13 days and compared to the CPI published by the U.S. Bureau of Labor Statistics, the correlation coefficient is 0.959 with an R² of 0.926. This indicates that Truflation explains approximately 93% of the variation in CPI year-on-year movements within this regime.
Exhibit 4 - TruCPI-US YoY Adjusted for 13 days vs the BLS CPI YoY
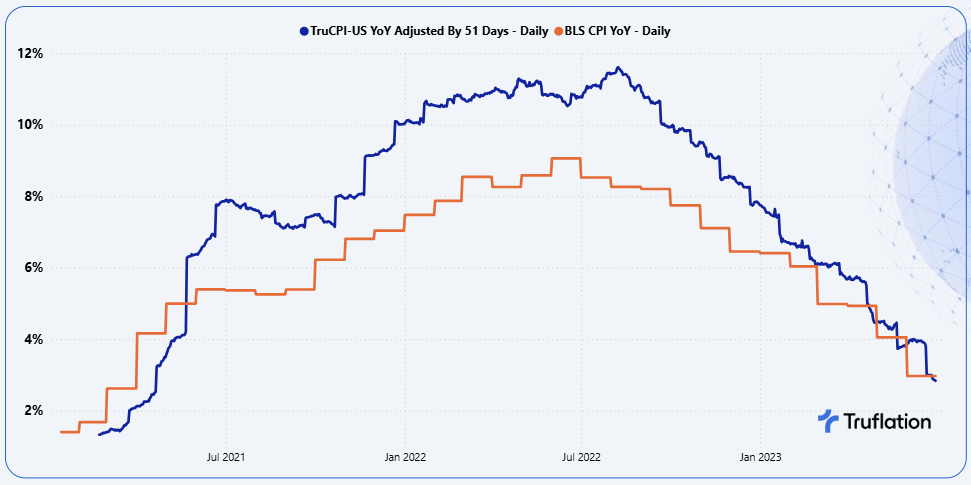
High Volatile Inflation (January 1, 2021 - June 30, 2023)
This period was characterized by significant fiscal stimulus, demand-driven inflation, supply chain disruptions and heightened commodity volatility exacerbated by the Ukraine War, particularly impacting global food and energy markets.
These conditions led to rapid repricing across goods and services, while BLS CPI components, especially shelter, adjusted more slowly due to methodological smoothing, imputations and sampling lags.
During this regime, Truflation leads CPI by approximately 51 days, with a correlation coefficient of 0.968 and R² of 0.939. This suggests that Truflation explains around 94% of the variation in CPI movements during periods of heightened inflation volatility.
Exhibit 5 - TruCPI-US YoY Adjusted for 51 days vs the BLS CPI YoY
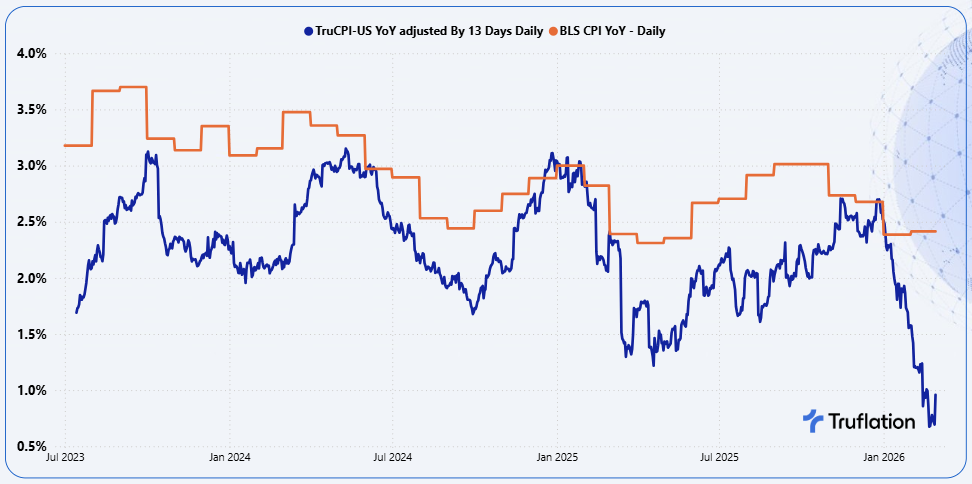
Disinflation / Return to Normalisation (July 1, 2023 - February 28, 2026)
In this phase, inflation stabilized at lower levels (generally below 3%), with reduced volatility and a return to more predictable pricing dynamics. While external factors such as tariffs introduced short-term disruptions, overall conditions reflected a normalization of post-pandemic price behavior.
During this period, Truflation’s lead compresses back to approximately 13 days, with a correlation coefficient of 0.706 with an R² of 0.586. This indicates a more moderate explanatory relationship, with Truflation accounting for roughly 59% of BLS CPI variation as inflation dynamics stabilized.
Two important considerations during this period are:
- Government shutdowns in October 2025 and January 2026, which not only disrupted data collection but had a considerable impact on the reporting timelines and returning them to normal cycles.
- Tariff related price shocks,Tariff-related which were captured more immediately in Truflation but reflected more slowly in BLS CPI
Exhibit 6 - TruCPI-US YoY Adjusted for 13 days vs the BLS CPI YoY
The analysis demonstrates that Truflation’s lead over the BLS CPI is structurally dependent on the underlying inflation environment. This relationship is driven by differences in price-setting frequency, data collection cadence, and methodological smoothing / imputations.
- In stable inflation environments, Truflation leads by approximately 10–15 days
- In high volatility regimes, the lead expands to approximately 50+ days, reflecting faster real-time price adjustments in Truflation.
This regime dependence is a fundamental characteristic of real-time inflation measurement and underscores Truflation’s value as a forward-looking indicator across varying macroeconomic conditions.
5. Why Truflation Acts as a Leading Indicator
The evidence clearly demonstrates that Truflation systematically leads the CPI published by the U.S. Bureau of Labor Statistics in a structural, predictable, and consistent manner. This lead is not incidental; it is a direct result of fundamental differences in methodology and data collection between the two indices. Truflation’s forward-looking signal is underpinned by several persistent structural advantages:
- Real-time price collection from both public and private sources, updated daily
- Millions of observations across a broad range of goods and services, sourced from 30+ datasets, enhancing representativeness and robustness
- No smoothing or imputation, allowing the index to reflect actual market conditions as they occur
Together, these features create an index that is inherently more responsive to rapid changes in economic conditions, explaining its consistent and structural lead over CPI.
forward-looking
The evidence presented in this paper demonstrates a strong and consistent relationship between Truflation and the BLS CPI. Changes in Truflation reliably precede similar movements in CPI, with inflation peaks and troughs appearing earlier in the Truflation data. This forward-looking relationship makes Truflation particularly valuable for:
- Identifying inflation inflection points
- Anticipating potential policy responses
- Forecasting official CPI releases
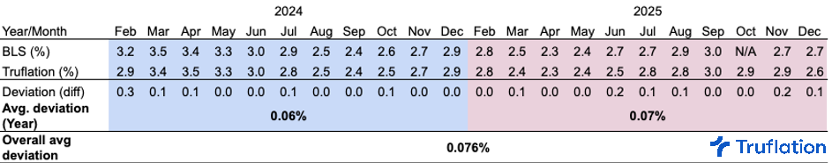
Since the launch of Truflation’s prediction tool in November 2022, forecast accuracy has steadily improved. The average deviation relative to the actual BLS CPI has been approximately 0.08, improving from 0.14 in 2023 to 0.07 in 2025; a reduction of roughly 50%. Additionally, forward quarterly forecasts have achieved an average deviation of approximately 0.1%, underscoring the robustness of Truflation’s predictive capabilities.
The table presents Truflation’s CPI prediction performance for 2024 and 2025.
7. Conclusion
Truflation is a statistically validated leading indicator of U.S. inflation, consistently anticipating BLS CPI movements across a range of macroeconomic environments.
Its structural lead is driven by fundamental differences in:
- Data frequency
- Collection methodology
- Real-time capture of price adjustments
As inflation dynamics evolve, Truflation remains robust, exhibiting a stable lead in normal conditions and an expanded lead during periods of heightened volatility. By transforming inflation measurement from a lagging statistical output into a real-time, forward-looking signal, Truflation provides meaningful value for policymakers, investors, and quantitative analysts alike.