
Inflation isn't drifting higher. It's climbing stairs.

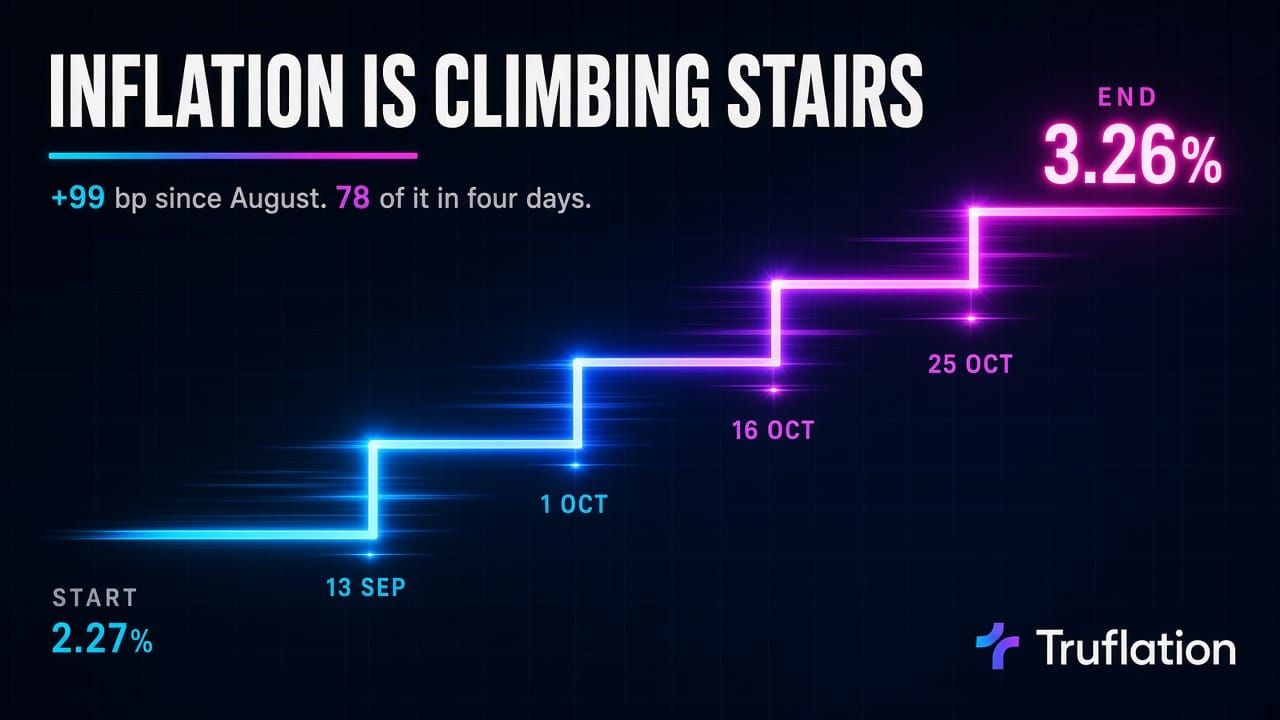
Truflation US CPI: 3.26% YoY (28 Oct, −0.03 on the day)
31 Aug: 2.27%. Change since: +99 bp in eight weeks.
Four one-day steps: 13 Sep +14 bp, 1 Oct +21 bp, 16 Oct +16 bp, 25 Oct +26 bp. Together: +78 bp.
Every other day since 31 Aug combined: about +21 bp.
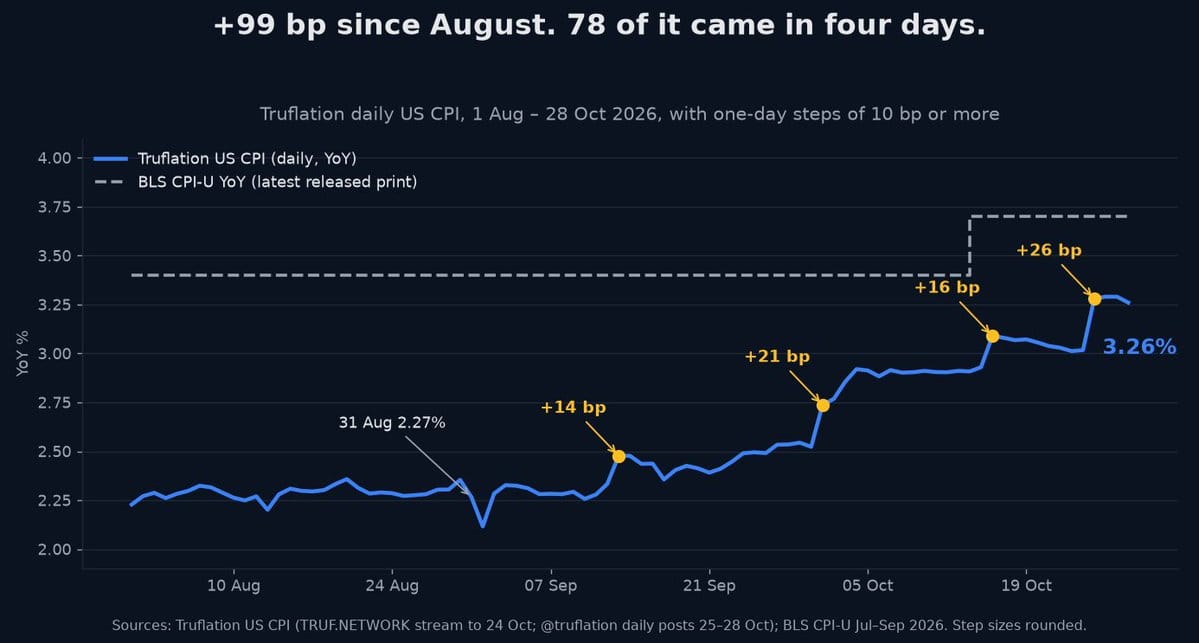
BLS CPI: 3.7% YoY (September, released 14 Oct). Core 2.6%. Gasoline +34.2% YoY.
FOMC 28 Oct: held at 3.75–4.00%, 10–2. Two dissents wanted a hike.
Next BLS CPI: 10 Nov (October print).
The Truflation real-time live index has added a full percentage point since the end of August. That is the trend in the data right now. But the shape of the climb matters more than its size, and the shape is not a slope.
It's a staircase.
80% of the move came in four days.
Truflation's daily US CPI sat between 2.20% and 2.36% through August. It closed the month at 2.27%. Today it reads 3.26%.
Take every daily move since then and sort them by size. Four days do almost all of the work: +14 bp on 13 September, +21 bp on 1 October, +16 bp on 16 October, and +26 bp on 25 October. That's 78 basis points out of 99. The other ~50 days, taken together, added about 21.
Between the steps, the index mostly goes sideways or gives a little back. After the 16 October jump to 3.09%, it faded for a week to 3.01%. After the 25 October jump to 3.28%, it printed 3.29, 3.29, then 3.26 yesterday.
This is what an inflation index looks like when costs are repricing in lumps rather than grinding up across the whole basket. It also tells you how to read it. A step is not noise, and the fade after it is not a reversal. Each step resets the floor.
What a step actually is
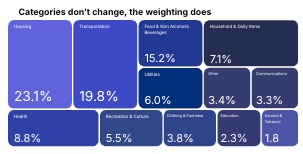
Truflation's index covers 12 spending categories. Some inputs update daily. Others are monthly or annual sources that get carried forward until the next release lands. When one of those lands, the index catches up in a single session to costs that had been building for months.
The 25 October step is the cleanest example, because Truflation published the driver. KFF's annual employer health-insurance survey came in: average premiums of $9,804 for single coverage and $28,303 for family coverage, both about 5% above last year. Workers' own share of family coverage rose 9% to $7,471.
Nobody's premium jumped overnight on a Saturday. That cost had built up over twelve months. The index just recognized it when the data arrived.
That's the honest way to read every step. The day the number moves is the day the data arrived, not the day the cost showed up for households.
The cost the official clock barely sees
Health insurance shows why live and official inflation can disagree for reasons that have nothing to do with timing.
Truflation carries health-insurance premiums directly, at 6.2% of its basket inside an 8.8% health category. In Truflation's July 2026 monthly report, the health category was running at 10.1% year over year.
BLS medical care was 1.7% in the same month. The BLS doesn't price premiums. It estimates health insurance indirectly, through insurers' retained earnings. So a 9% jump in what workers pay for family coverage can barely register in the official index.
That's a methodology gap, not a lag. You can wait for every official release and you still won't see it.
what's holding the level down
If health and energy are pushing, why is live CPI still below the 3.7% official print? Housing.
Truflation weights housing at 23.1% of its basket, using 2026 household-spending data. Shelter is about 34% of BLS CPI.
More importantly, Truflation prices owner-occupied housing as an actual cost of ownership: property values, mortgage rates, taxes, insurance, maintenance. The BLS imputes it as a rent (owners' equivalent rent) from a survey panel that rotates every six months.
In July, Truflation's housing category was −4.0% year over year. BLS shelter was +3.2%.
So the gap between the two clocks, about −0.48 on our Divergence Index today, isn't a sign live inflation is soft. It's a different mix. Truflation has a much lighter, falling housing anchor and a heavier, rising health and energy load. Official carries a heavy shelter weight that moves slowly and leaves health insurance out.
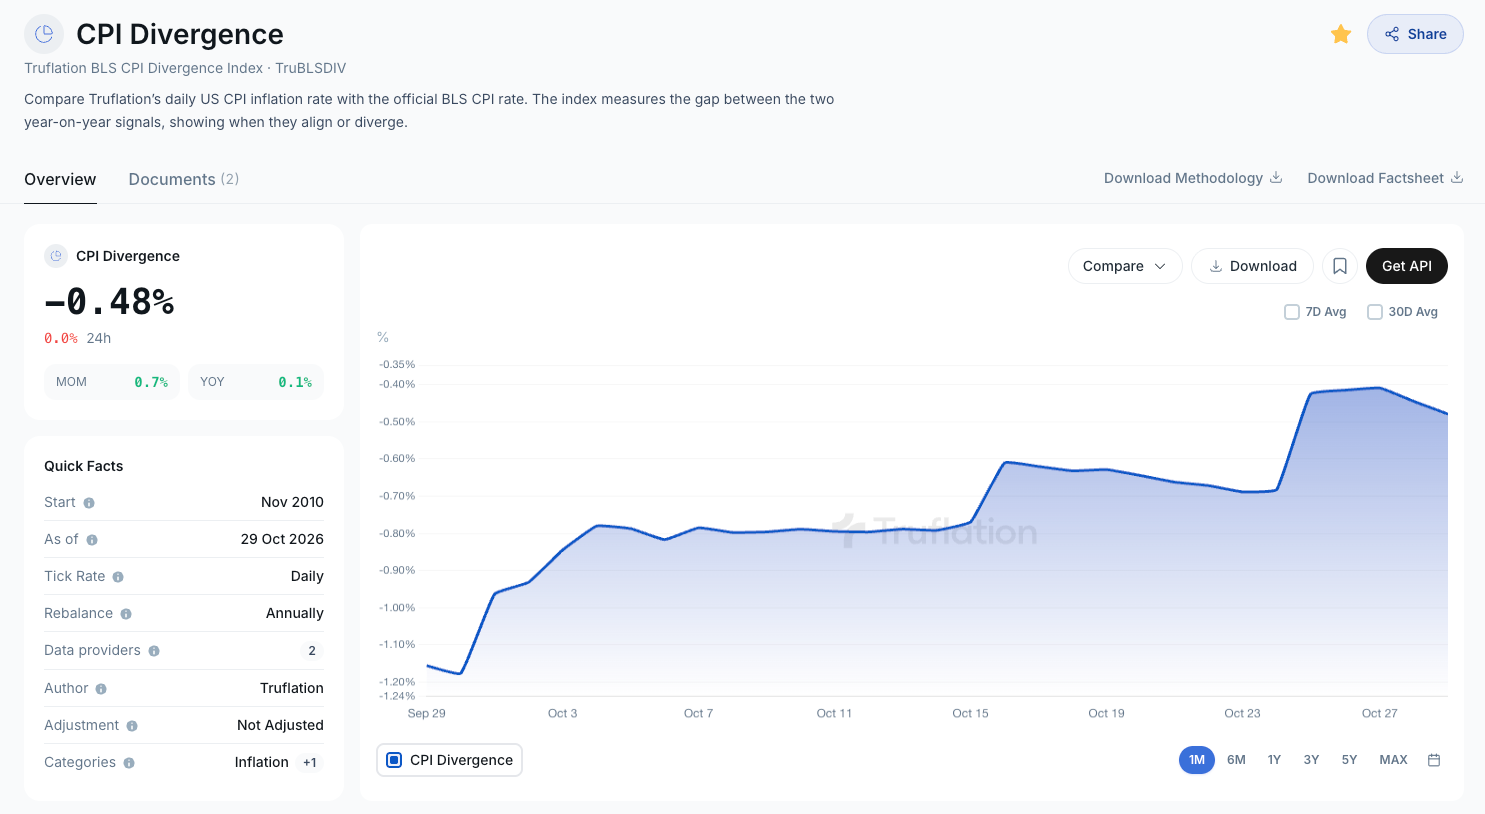
Watch the composition, not just the headline gap. If the stairs keep coming from health, energy and services, the 3.7% official print won't fall as fast as the fading shelter trend alone would suggest.
What the Fed just told you
Yesterday the FOMC held at 3.75–4.00%, one month after September's hike. The vote was 10–2, and both dissents, Lisa Cook and Beth Hammack, wanted another quarter point. Chair Warsh, in the press conference: "Inflation is too high."
Truflation's PCE report, published a day ahead of the BEA release, was titled "Supply Shocks Drive Inflation, but Second Round Risks Are Growing." It names elevated energy costs, higher tariffs and growing evidence of pass-through as the forces narrowing the Fed's room to cut.
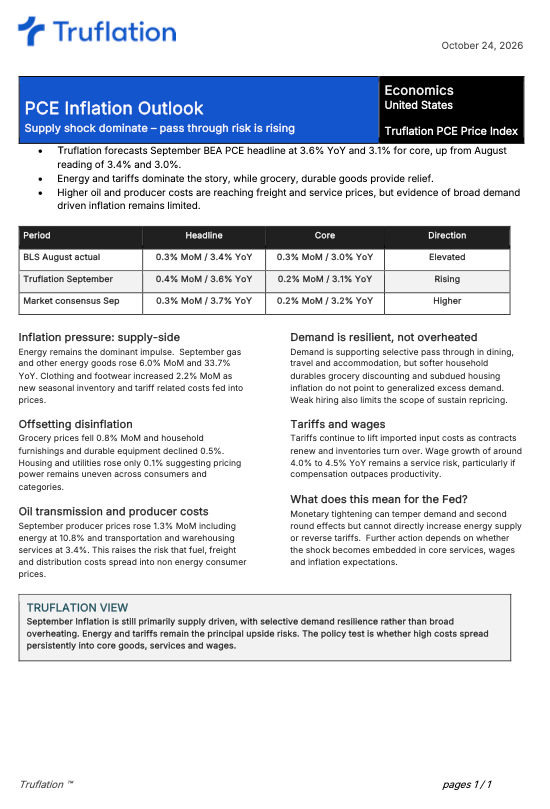
The staircase is what pass-through looks like in daily data. A supply shock is one step. Second-round effects are the steps that keep coming afterward: insurers repricing, landlords and service providers resetting contracts, firms passing input costs into list prices. One step is a shock. Four steps in eight weeks starts to look like a process.
What to watch into 10 November
Three things in the daily series, before the October BLS print:
- Does the floor hold? If live CPI stays above 3.2% through early November, the 25 October step was a reset, not a blip.
- Where does the next step come from? Another energy step would be a supply story. A step from services or household goods would be second-round.
- Does the fade between steps get shorter? After 16 October the index gave back 8 bp in a week. Since 25 October it has given back 3 bp in three sessions. Shorter fades mean steps are stacking.
Truflation's own research puts the index's lead on the official CPI at about 45 days.
The official October print lands 10 November. The daily index has already shown you most of the staircase.Don't wait for the monthly number to tell you inflation re-accelerated. Count the steps.