April CPI Number - Oliver Rust Commentary

CPI came in "Hotter than Expected," "Highest in Three Years," but….
…it was driven by energy and an imputed methodological error in Shelter.
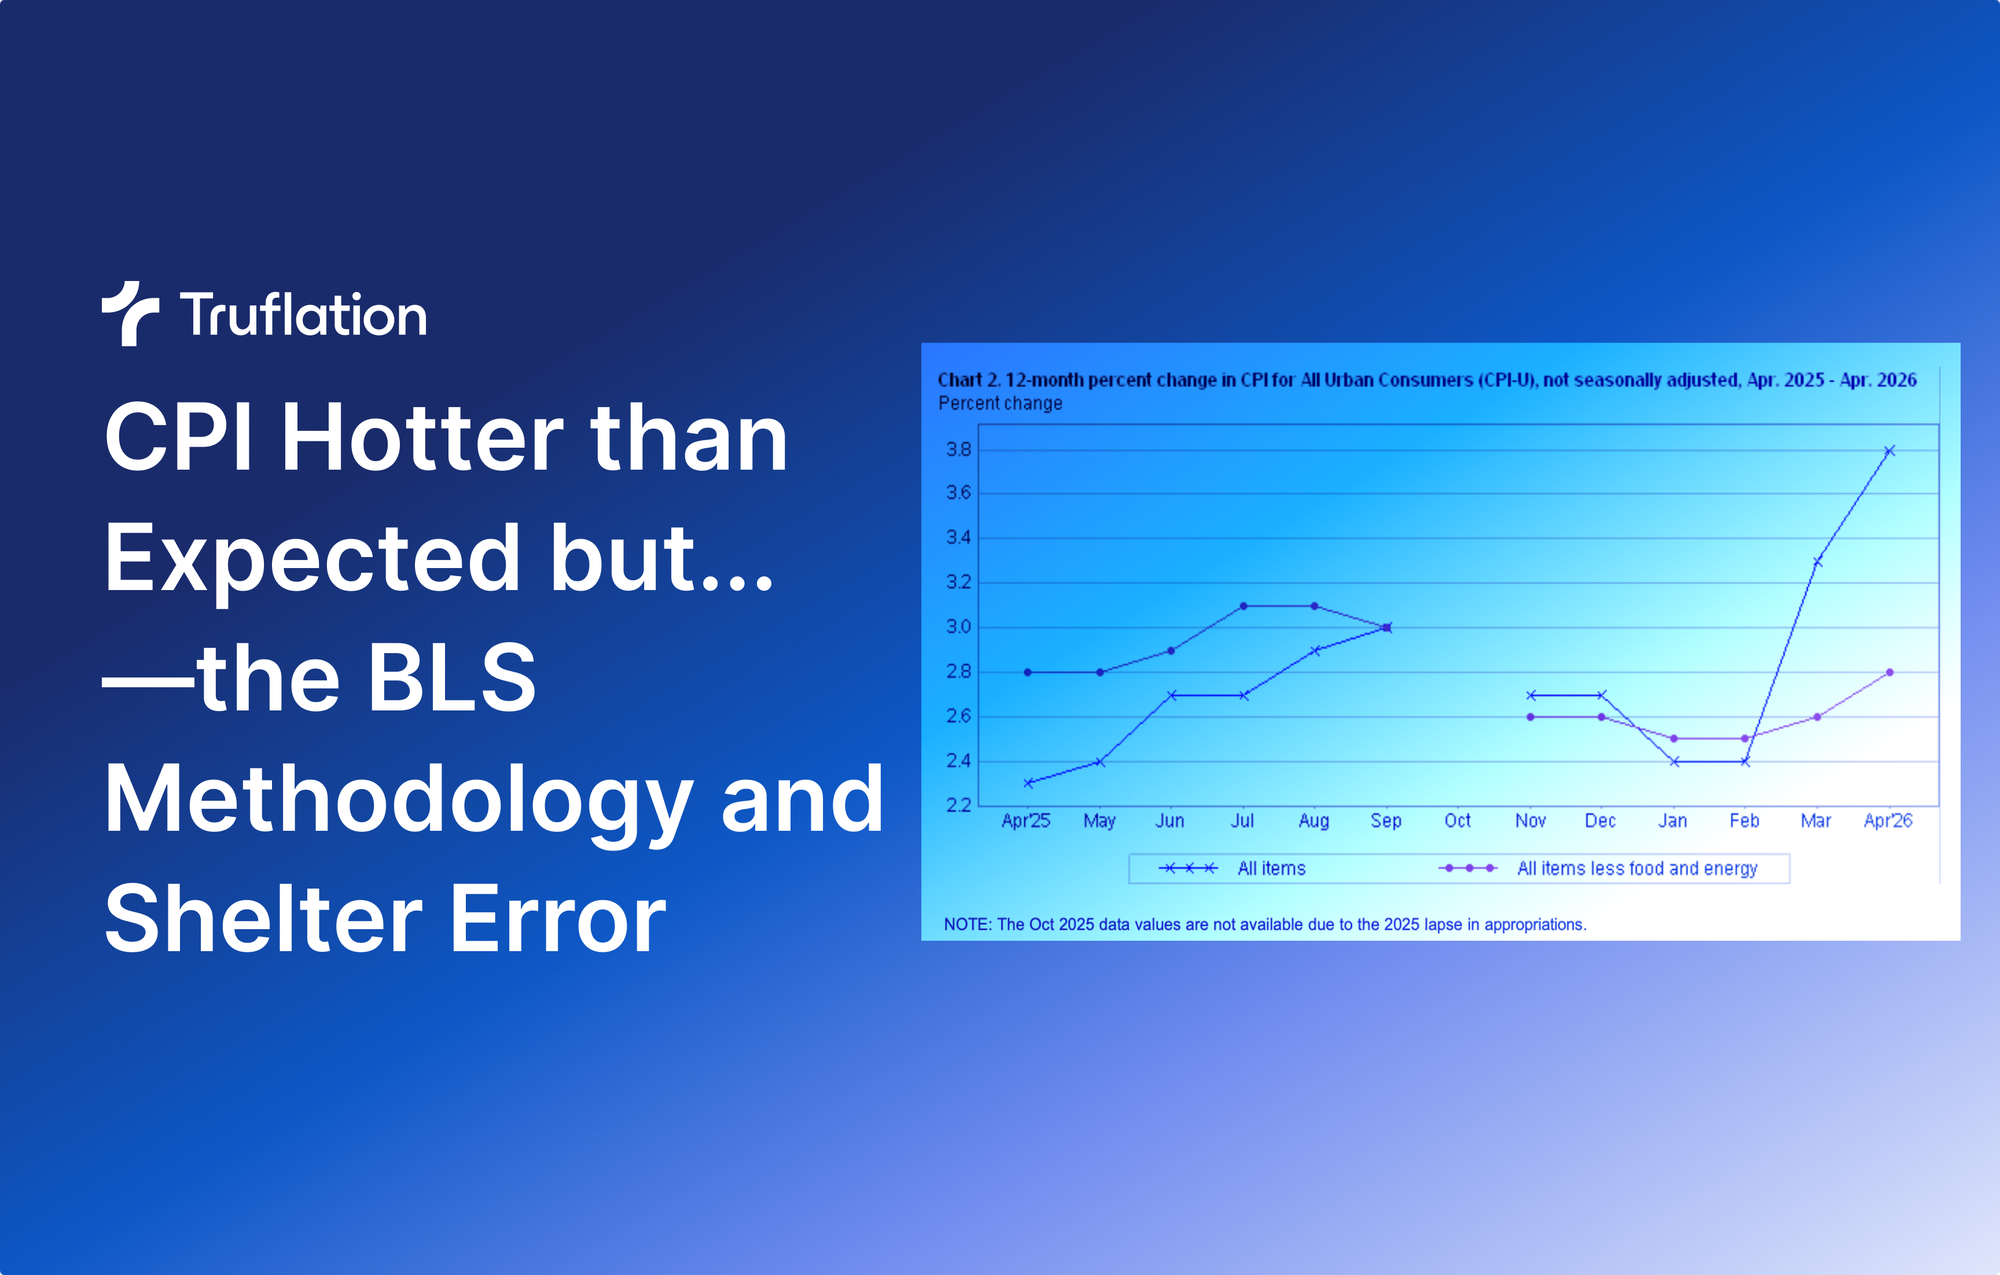
Prices paid by consumers for goods and services, as measured by the BLS CPI, rose faster than expected in April. Another sharp increase in energy prices pushed headline inflation from 3.3% in March to 3.8% in April, the highest level since May 2023.
Inflation increased 0.6% month over month, bringing the year-over-year pace to 3.8%, ahead of the Truflation forecast of 3.7%.
Energy prices surged 3.8% during the month, accounting for more than 40% of the headline increase, while food and apparel prices rose 0.5% and 0.6%, respectively. These figures were largely aligned with Truflation’s projections. On a year-over-year basis, energy inflation accelerated to 17.9%, while food and apparel rose 3.2% and 4.2%.
Although energy, particularly gasoline, has dominated the inflation narrative, those higher costs are now flowing through into broader energy-sensitive categories such as airline fares, transportation, and logistics costs.
The most surprising component in the report was shelter inflation, which the BLS CPI reported as rising 0.6% after moderating in prior months. However, this figure is misleading due to distortions caused by the methodology used in collecting housing data and helps explain why the April reading came in above both market and Truflation expectations.
The issue stems from the 2025 federal government shutdown. During the shutdown, BLS shelter data collection in October 2025 was suspended because of a lapse in appropriations. As a result, the BLS was forced to use carry-forward imputation methods that temporarily masked underlying rent increases.
This means the April 2026 Rent and Owners’ Equivalent Rent (OER) figures effectively represented a statistical “catch-up,” compressing roughly 12 months of rental inflation into a six-month reporting period rather than reflecting a normal monthly increase.
Because October 2025 shelter prices were carried forward, the shelter component, which accounts for more than 40% of Core CPI, failed to capture true market rent increases during that period. This artificially suppressed inflation readings in late 2025 while contributing to an exaggerated rebound in April 2026.
What does this mean for May and June? The large April statistical catch-up spike, which incorporated months of previously unrecorded rent increases all at once, is unlikely to repeat. As a result, the month-over-month shelter index is expected to decelerate sharply toward more normal historical levels.
Since shelter represents more than 40% of the Core CPI calculation, this moderation in monthly shelter growth should exert a strong mechanical downward pull on May’s Core CPI reading, potentially making inflation appear to cool significantly.
By June, the shelter panel rotation should have fully cycled past the missing October 2025 dataset, returning the data collection process to a cleaner statistical baseline without carry-forward distortions. However, while the month-over-month data should normalize, the year-over-year inflation figures will remain somewhat structurally distorted. Because portions of the late 2025 shelter baseline rely on imputed rather than directly collected data, the 12-month comparison base remains artificially warped, limiting the reliability of annual inflation comparisons for several more months.
For better context read our Monthly Inflation Report
Oliver Rust is a data veteran with over 20 years of experience. Formerly at Nielsen and Engine Group. Currently, Head of Data at Truflation and the creator of our forecasting model, at 99.93% accuracy over 3 years.