Truflation US CPI as a Leading Indicator of the BEA PCE Index

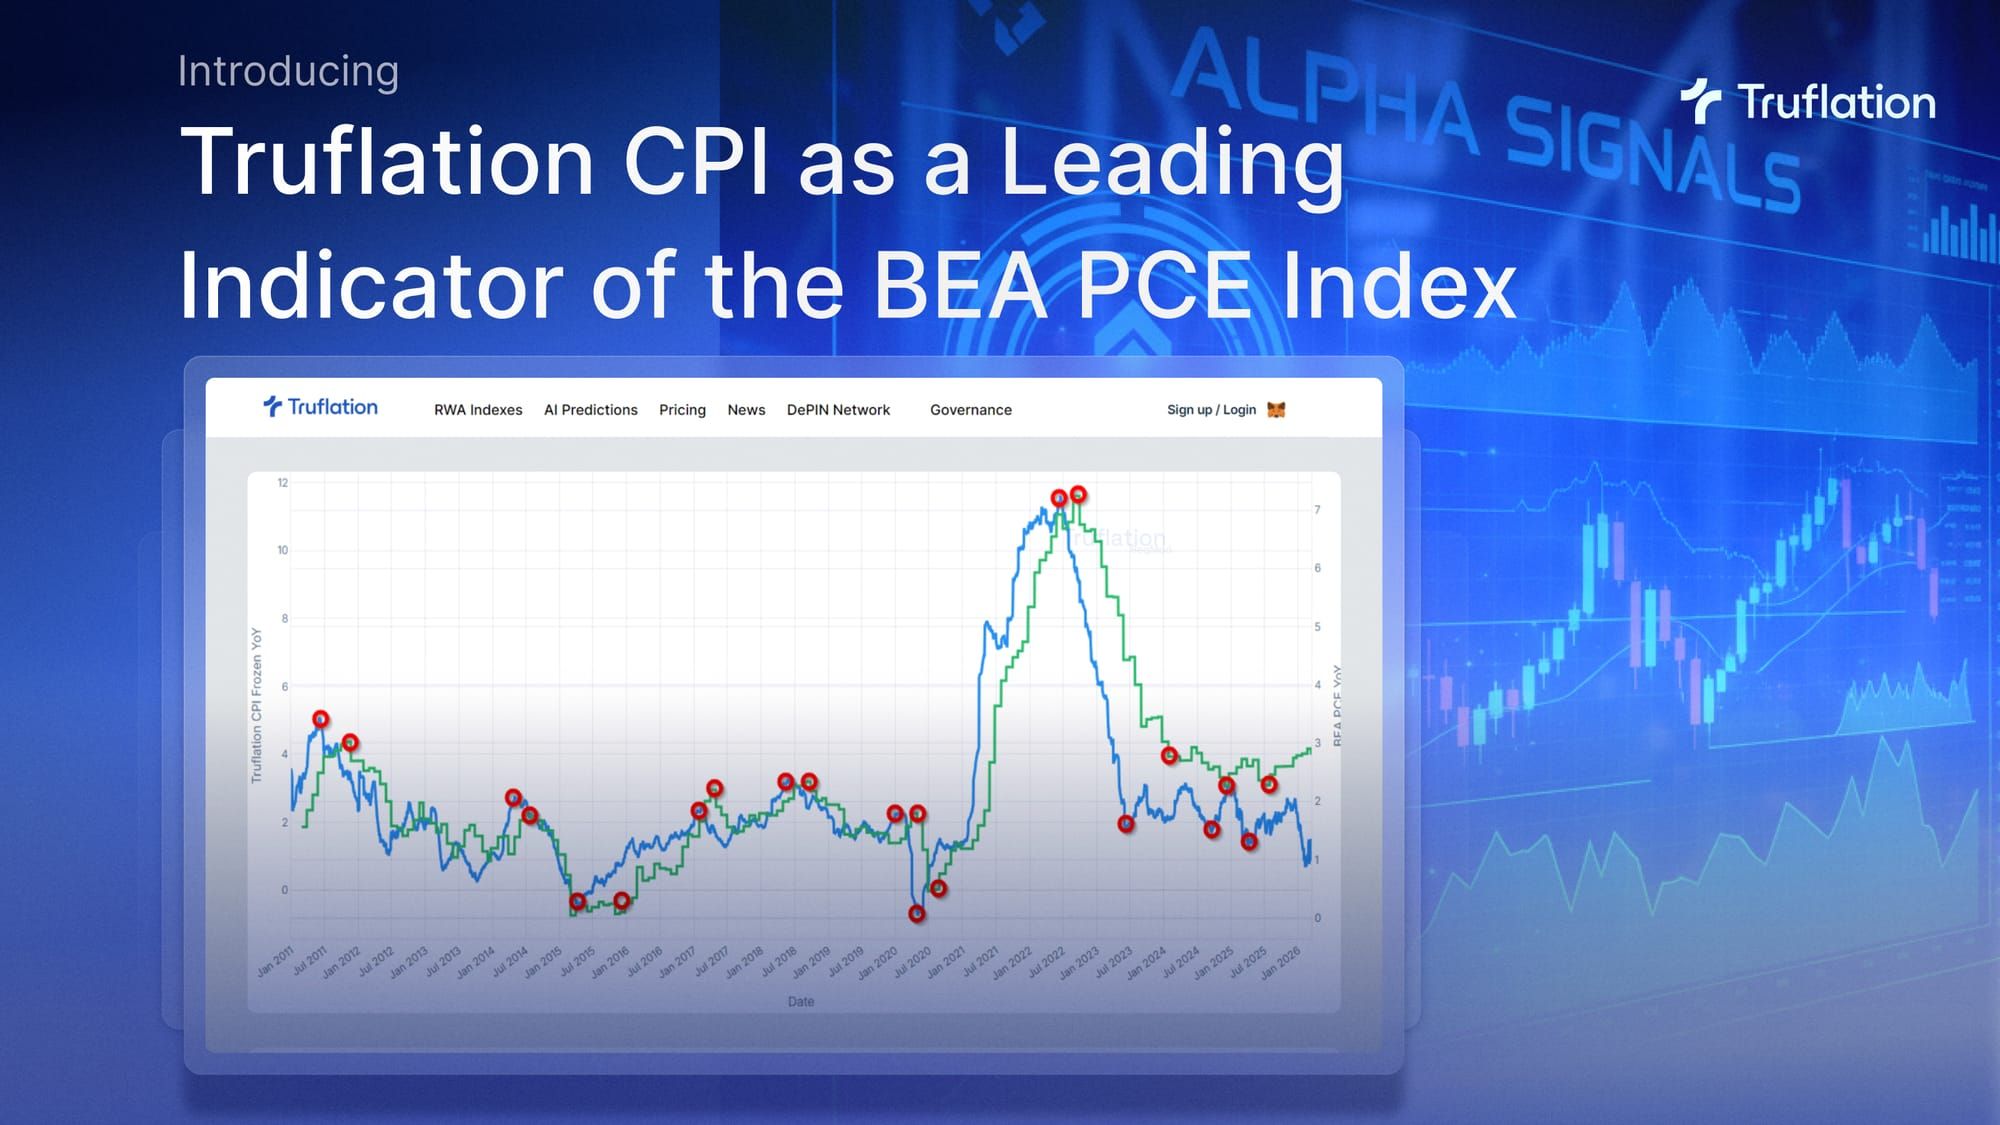
Version 1.0 - April 2, 2026
Empirical Evidence of Signal Lead and Regime-Dependent Dynamics
1. Introduction
Truflation provides a high-frequency, data-driven measure of inflation designed to reflect real-time price dynamics across the economy. Traditional measures such as the Personal Consumption Expenditure Price Index (PCE), published by the U.S. Bureau of Economic Analysis (BEA), remain the preferred inflation benchmark for the Federal Reserve; however, they are structurally backward-looking due to:
- Monthly data collection cycles
- Business survey, retail sales and administrative datasets that are delayed
- Publication lags in the reporting schedule
These characteristics introduce a systematic information delay for policymakers, investors and risk managers. Truflation addresses this limitation by aggregating over 15 million price points across 30+ data sources, producing a daily inflation index that reflects current market conditions.
A consistent empirical observation is that Truflation not only tracks BEA PCE closely but systematically leads it. This paper formalizes that relationship through statistical analysis across distinct macroeconomic regimes.
2. Key Differences in Methodology
The Bureau of Economic Analysis, Personal Consumption Expenditure Price Index is designed to capture total consumer spending across the economy, not just out-of-pocket purchases but also goods and services directly purchased by households, as well as services paid on behalf of households, such as employer-provided healthcare or government-funded programs e.g., Medicare, Medicaid. PCE aims to also measure inflation in a way that reflects actual consumer behavior over time, incorporating changes in spending patterns (substitution between goods and services) and shifts in consumption weights as a relative price change. However, there are fundamental differences between BEA PCE and Truflation in data coverage, timeliness, and calculation methodology:
- Data Frequency & Timeliness: Truflation operates on a daily, real-time basis, continuously ingesting price data, whereas PCE is published monthly with a lag and relies on data that is often weeks or months old. This makes Truflation inherently forward-looking, while PCE is retrospective.
- Data Collection Approach: Truflation uses a high-frequency, multi-source census approach, aggregating millions of price points from digital platforms, private datasets, and public sources. In contrast, PCE is built from aggregate national accounts data, including business surveys, retail sales, and administrative records, rather than direct price observation at scale.
- Treatment of Substitution & Adjustments: PCE explicitly incorporates substitution effects and imputation techniques, adjusting for changes in consumption and estimating missing components. Truflation largely avoids these by using real transaction and price data, allowing changes in behavior to appear organically in the dataset.
- Housing Measurement: PCE (similar to CPI) relies heavily on imputed measures such as Owner’s Equivalent Rent (OER) and rental surveys. Truflation instead incorporates actual housing market dynamics, including home prices, mortgage rates, and rental data, providing a more immediate reflection of housing costs.
- Revisions vs. Finality: PCE is frequently revised, sometimes significantly, as new data becomes available. Truflation publishes frozen values, meaning once released, they are not revised, making them more useful for real-time decision making and backtesting.
- Responsiveness to Economic Shocks: Because of its high-frequency inputs and lack of smoothing, Truflation reacts quickly to supply shocks, demand shifts, and price volatility. PCE, due to aggregation, smoothing, and lagged inputs, adjusts more slowly, especially during periods of rapid inflation or disinflation.
In essence, PCE is designed for accuracy and completeness, making it ideal for policy benchmarking, while Truflation is designed for speed, transparency, and real-time insight, making it more effective as a leading indicator of inflation dynamics.
3. Data and Analytical Methodology
The analysis compares the year-on-year percentage change of the Truflation U.S. CPI Inflation index and the PCE published by the U.S. Bureau of Economic Analysis, covering the period from January 2011 to February 2026.
To ensure comparability, differences in the data frequency between the two series must be reconciled through temporal aggregation. Specifically, Truflation’s daily observations are aggregated to a monthly frequency to align with the lower frequency BEA PCE data.
To quantify the lead-lag relationship, a Pearson correlation-based time series analysis is employed, using cross-correlation to identify the temporal offset between the two series. Aggregating Truflation data to a monthly frequency ensures that both datasets contain the same number of observations, enabling robust statistical comparison.
In addition, PCE data is aligned to its official release dates rather than the reference month. For example, the PCE value for January 2026 is assigned to its publication date of March 13, 2026, however in normal circumstances, the BEA PCE is released on the 30th of the following month. The delay of the January release was due to the Government Shutdown. This treatment reflects the actual timing of information availability to market participants and accounts for the absence of a precise observation date within the reference month. As a result, the analysis captures the effective real-time informational lag embedded in the PCE release process.
For the lag analysis, a shifted Truflation series is constructed by systematically delaying the index across the range of intervals. At each shift, the correlation coefficient is calculated against the corresponding PCE values. This process produces a correlation profile across time offsets, allowing for the identification of the lag at which the relationship between Truflation and BEA PCE is strongest.
4. Results
The chart in Exhibit 1 plots the monthly PCE data published by the U.S. Bureau of Economic Analysis alongside both the daily Truflation U.S. CPI Inflation Index and its aggregated monthly equivalent.
Exhibit 1: BEA PCE Price Index YoY vs. TruCPI-US (Daily and Monthly Aggregated)
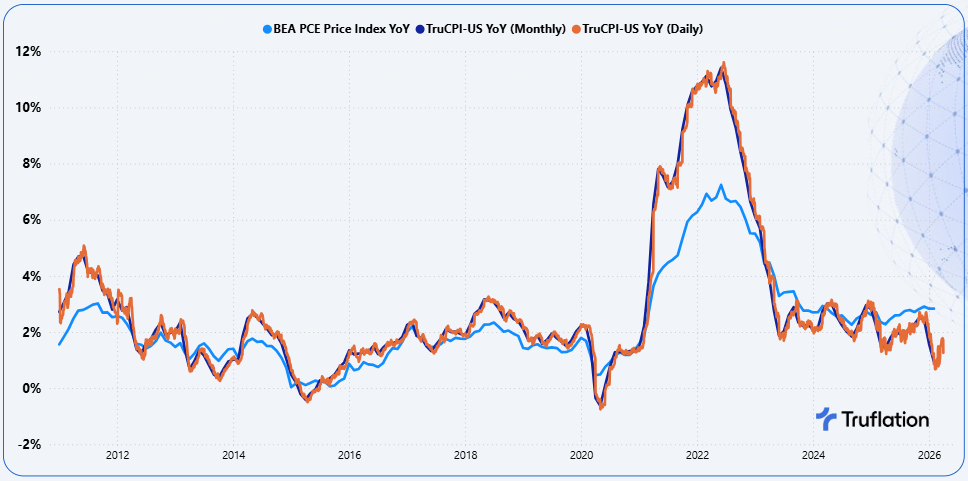
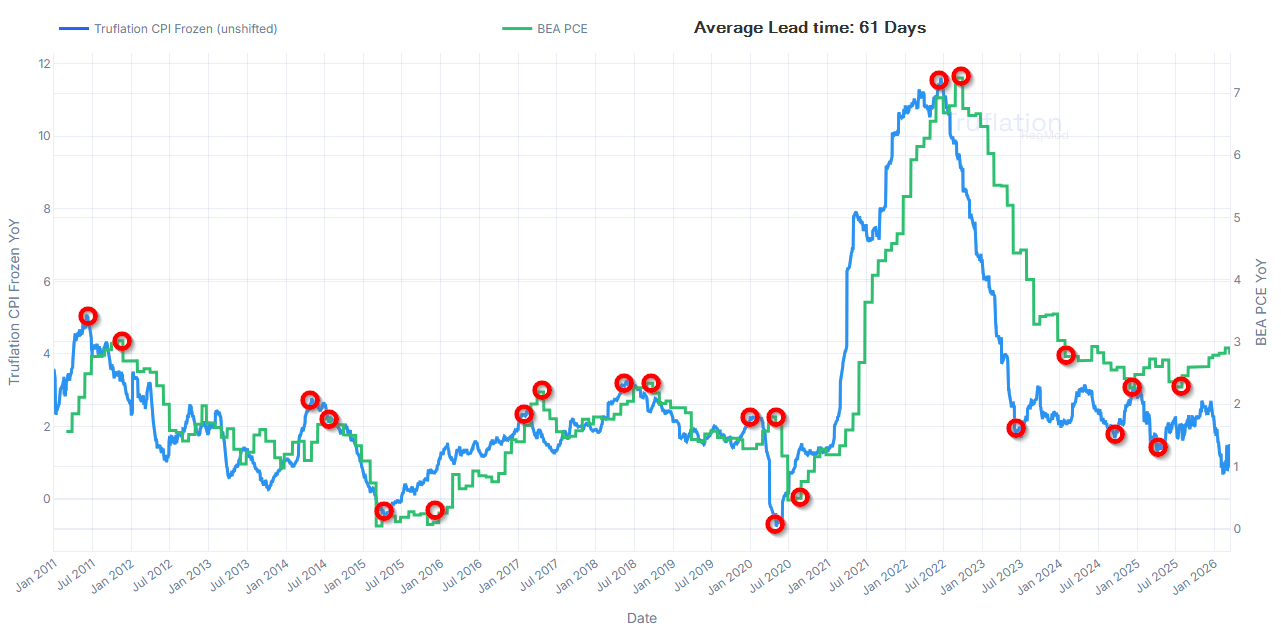
Visually, Truflation appears to lead the PCE series. Peaks, troughs and turning points in inflation are observed earlier in the Truflation data, supporting the view that Truflation functions as a leading indicator.
To quantify this relationship, a linear regression analysis was conducted, with TruCPI-US as the independent variable and BEA PCE Price Index as the dependent variable. Over the period from January 2011 to February 2026, the resulting correlation coefficient is 0.934, indicating an exceptionally strong positive relationship between the two series.
Cross correlation analysis further refines this result. The highest cross correlationW is observed when Truflation is shifted forward by 61 days, implying a consistent lead of approximately eight weeks relative to BEA PCE. This lead is structural rather than coincidental, reflecting fundamental differences in methodology, including data collection frequency, publication lags, and imputation techniques.
Exhibit 2 illustrates this relationship by plotting the BEA PCE Price Index alongside Truflation (both daily and monthly) shifted forward by 61 days.
Exhibit 2: BEA PCE Price Index YoY vs. TruCPI-US (Daily and Monthly) adjusted for a 61-day lead time
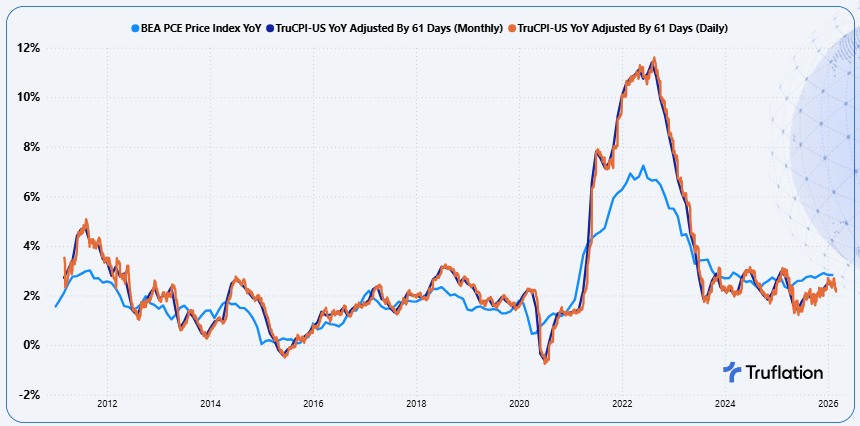
When adjusted for this lag, the correlation improves modestly to 0.943 (March 2011 to February 2026), further reinforcing Truflation’s role as a leading indicator.
However, these results should be interpreted with caution, as inflation dynamics vary significantly across the sample period. From 2010 through 2020, inflation was generally low, stable and often below the Federal Reserve target. In contrast, the period from 2021 to 2023 was highly atypical, characterized by stimulus-driven demand, supply chain disruptions, sharp increases in housing costs, and broad based price volatility, followed by an unusually rapid disinflation phase. These shifts affected both the speed and transmission of price changes across the economy.
As a result, the full sample correlation reflects a mixture of heterogeneous inflation regimes rather than a single stable relationship. Segmenting the data reveals distinct macro inflation environment dependent lag structures, as shown in Exhibit 3.
Exhibit 3 - Segmented Inflation Periods
The longer lead observed during the high volatility period (91 days) reflects the accelerated pace of price adjustments during inflation shocks, combined with the slower response of BEA PCE due to its fixed sampling and imputation processes. Consequently, the full sample peak does not represent a single structural lag, but rather an average across fundamentally different macroeconomic environments.
Macro Inflationary Environment Specific Correlation Analysis
To address the mixing effect observed in the full period analysis, the dataset is segmented into three distinct macroeconomic environments.
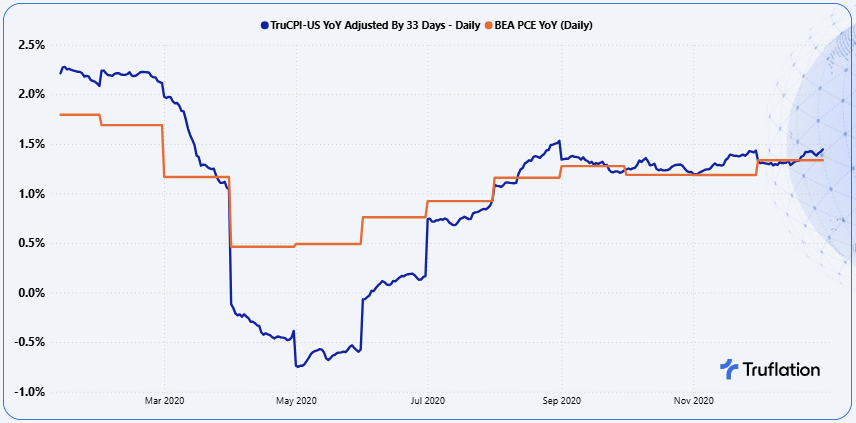
Low Consistent & Stable Inflation (January 1, 2020 - December 31, 2020)
In this period, inflation dynamics were relatively stable with gradual and infrequent price adjustments. As a result, movements in inflation were smooth and consistent.
When the TruCPI-US series is lagged by 33 days and compared to the PCE Price Index, the correlation coefficient marginally improves to 0.979 with an R² of 0.951. This indicates that Truflation explains approximately 95% of the variation in PCE year on year movements within this regime.
Exhibit 4 - TruCPI-US YoY Adjusted for the lag vs the BEA PCE Price Index YoY
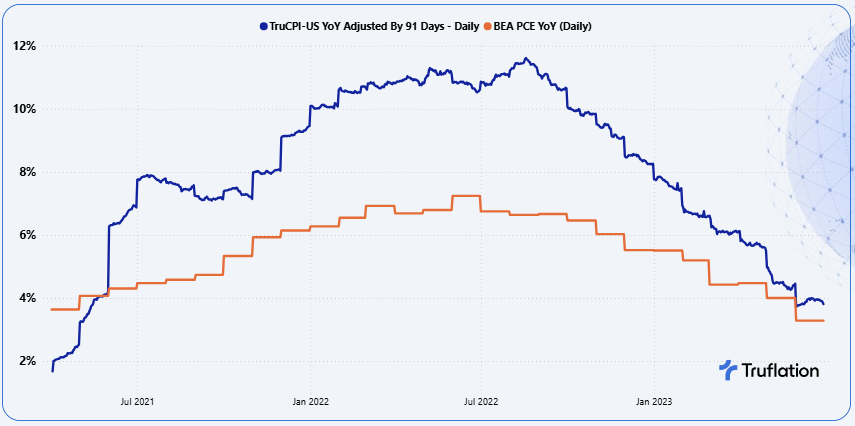
High Volatile Inflation (January 1, 2021 - June 30, 2023)
This period was characterized by significant fiscal stimulus, demand-driven inflation, supply chain disruptions and heightened commodity volatility exacerbated by the Ukraine War, particularly impacting global food and energy markets.
These conditions led to rapid repricing across goods and services, while BEA PCE components, especially shelter adjusted more slowly due to methodological imputations and sampling lags.
During this period, Truflation series is lagged by 91 days and compared to the PCE Price Index, the correlation coefficient is 0.939 and R² of 0.883. This suggests that Truflation explains around 88% of the variation in PCE movements during periods of heightened inflation volatility.
Exhibit 5 - TruCPI-US YoY Adjusted for the lag vs the BEA PCE Price Index YoY
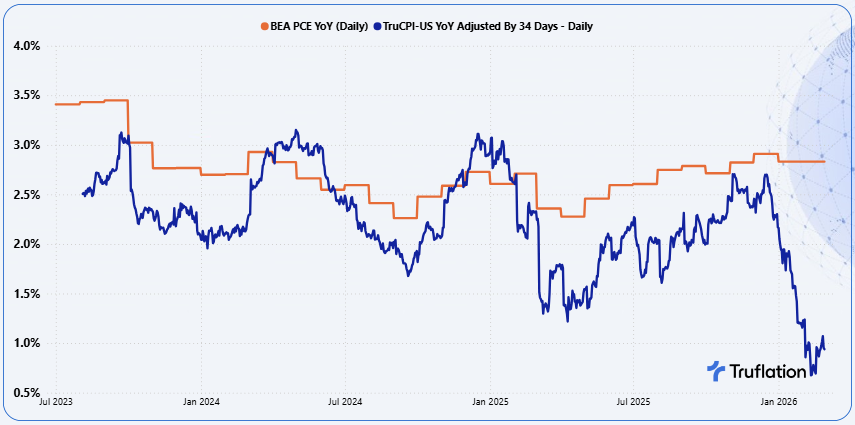
Disinflation / Return to Normalisation (July 1, 2023 - February 28, 2026)
In this phase, inflation stabilized at lower levels (generally below 3%), with reduced volatility and a return to more predictable pricing dynamics. While external factors such as tariffs introduced short term disruptions, overall conditions reflected a normalization of post pandemic price behavior.
During this period, Truflation’s lead compresses back to approximately 34 days, with a correlation coefficient of 0.350 with an R² of 0.123. This indicates a moderate positive relationship between the two variables. As one variable increases, the other does as well but the relationship is not particularly strong. This might be in part explained by two important factors during this period:
- Government shutdowns in October 2025 and January 2026, which not only disrupted data collection but had a considerable impact on the reporting timelines and returning them to normal cycles. The PCE Index will only return back to normal reporting cycles with the March 2026 delivery at the end of April.
- Tariff related price shocks which were captured more immediately in Truflation but reflected more slowly in BLS CPI
Exhibit 6 - TruCPI-US YoY Adjusted for the lag vs the BEA PCE Price Index YoY
The analysis demonstrates that Truflation’s lead over the BEA PCE Price Index is structurally dependent on the underlying inflation environment. This relationship is driven by differences in price setting frequency, data collection cadence, and methodological imputations.
- In stable inflation environments, Truflation leads by approximately 30-35 days
- In high volatility regimes, the lead expands to approximately 90+ days, reflecting faster real time price adjustments in Truflation.
This period dependence is a fundamental characteristic of real-time inflation measurement and underscores Truflation’s value as a forward looking indicator across varying macroeconomic conditions.
5. Why Truflation Acts as a Leading Indicator
The evidence clearly demonstrates that Truflation systematically leads the PCE Price Index published by the U.S. Bureau of Economic Analysis in a structural, predictable, and consistent manner. This lead is not incidental; it is a direct result of fundamental differences in methodology and data collection between the two indices. Truflation’s forward looking signal is underpinned by several persistent structural advantages:
- Real time price collection of millions of daily prices from both public and private sources, capturing price changes as they occur rather than a lagged macroeconomic data (retail sales, business surveys, administrative datasets), which are reported with delays.
- Continuous updating as Truflation updates daily, while PCE is released monthly with a roughly 28-30 day publication lag. By the time PCE is published, the underlying economic conditions may have already shifted which Truflation has already captured.
- No smoothing as the PCE uses chain-weighting and imputation techniques (for housing) to reflect evolving consumption patterns and reduce volatility. While methodologically robust, this dampens and delays the recognition of turning points. Truflation applies no smoothing, allowing it to detect inflection points in inflation much earlier.
- Faster transmission of economic shocks especially during periods of rapid inflation or disinflation, prices in the real economy adjust quickly. Truflation captures this high frequency repricing immediately, while PCE reflects it only after data collection, aggregation, and release cycles, creating a structural lag.
Truflation leads the PCE Price Index not by coincidence, but by design. Its high frequency, real time, price level methodology allows it to detect inflation turning points significantly earlier, while the PCE Price Index’s comprehensive but lagged and smoothed framework makes it a reliable but inherently backward looking benchmark.
6. Conclusion
Truflation is a statistically validated leading indicator of U.S. inflation, consistently anticipating BEA PCE Price Index movements across a range of macroeconomic environments.
Its structural lead is driven by fundamental differences in:
- Data frequency
- Collection methodology
- Real time capture of price adjustments
As inflation dynamics evolve, Truflation remains robust, exhibiting a stable lead in normal conditions and an expanded lead during periods of heightened volatility. By transforming inflation measurement from a lagging statistical output into a real time, forward looking signal, Truflation provides meaningful value for policymakers, investors, and quantitative analysts alike.