
Truflation vs BLS CPI: A Food Inflation Divergence


For July, The Bureau of Labor Statistics CPI reported a headline inflation of 3.4% YoY and core inflation of 2.5% YoY.
Truflation was spot on with its core inflation forecast, which is particularly significant given that core components account for nearly 80% of the CPI basket. The difference was primarily in headline inflation, where Truflation had expected a higher reading due to stronger price pressures across the more volatile Food and Energy categories.
Food Supply Constraints Remain Inflationary
Truflation expected a significant increase in food prices during July, partly reflecting supply constraints across several important categories, including beef, coffee, sugar, eggs, dairy and rice. These pressures are being driven by a combination of tighter supply, changing global weather conditions and higher production costs. Beef is one of the clearest examples.
The U.S. has experienced a slower pace of fed-cattle slaughter alongside reduced beef imports. This comes on top of a multi-year contraction in the U.S. cattle herd, with cattle inventories at multi-decade lows. The USDA expects cattle and feeder-steer prices to remain exceptionally elevated in 2026, with tight supply potentially keeping retail beef prices high for an extended period.Coffee represents another significant upside risk. Arabica prices rose sharply through June and July, with markets increasingly concerned about weather related production risks. Brazil remains particularly exposed to heat and irregular rainfall, while Vietnam, the world's largest robusta producer, has faced drought and pressure on irrigation supplies.These supply conditions suggest that underlying food price pressures remain elevated even where individual monthly CPI categories temporarily decline.
BLS May Be Capturing the Pressure With a Lag
From an inflation perspective, the divergence is particularly interesting because the BLS reported Meats, Poultry, Fish and Eggs declining 0.7% MoM, despite significant supply pressures across several of these markets. It highlights the potential timing difference between a traditional sampled CPI methodology vs Truflation's real time approach showed food prices rising broadly throughout July. This appears to reflect both underlying supply constraints and seasonal consumption patterns around the Fourth of July and summer holiday period, when household spending can shift toward higher-value and premium food products.
Truflation Food at home YoY Price changes
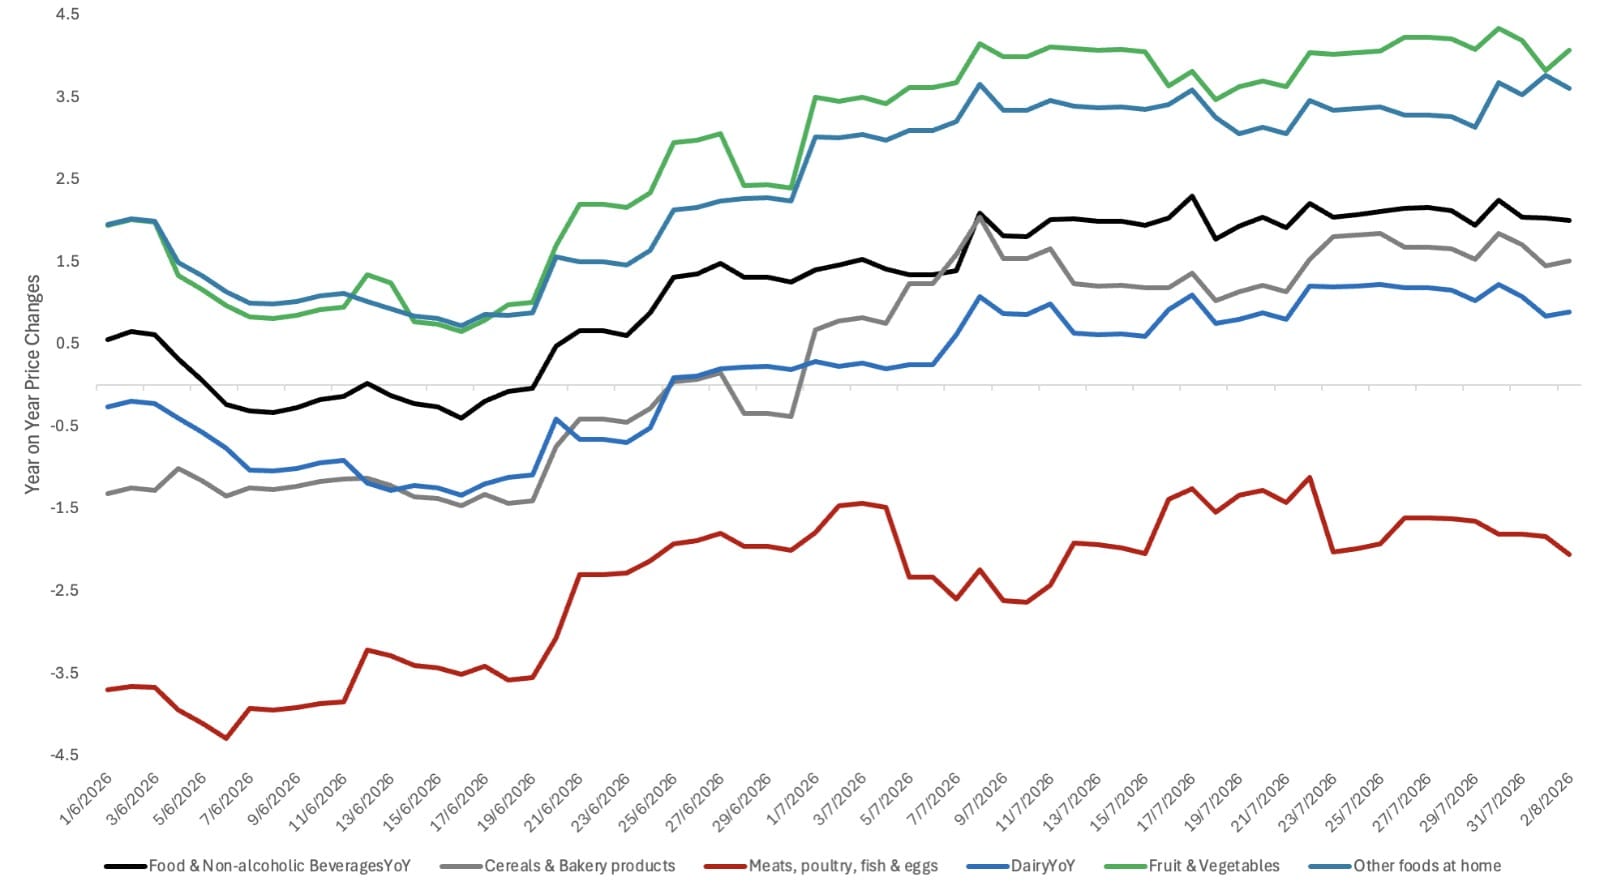
Why the BLS and Truflation Food Measures Can Differ
It is important to distinguish between the BLS Food CPI and actual prices being observed across the entire grocery market. The BLS Food CPI is designed to measure price changes of 70 individual grocery food items (like whole milk, white bread, ground beef, Grade A eggs etc) from a sample of products, outlets and geographic areas. It means that the BLS measure is not reflecting what actual individual household are experiencing.
This is where Truflation's methodology provides an important advantage. By incorporating substantially more granular and higher frequency pricing data, Truflation can capture a broader range of products and observe changes in consumer purchasing patterns and product substitution more quickly.The July divergence may therefore be less about the direction of underlying food inflation and more about when that inflation is being captured. If current supply constraints continue to feed through to retail prices, the pressures already visible in Truflation could become increasingly evident in subsequent BLS CPI releases.